
Giới thiệu chung
Lời mở đầu
Phần mềm FiinPro là công cụ thiết yếu để tìm hiểu và tiếp cận thị trường tài chính Việt Nam, cung cấp nguồn dữ liệu và thông tin đầy đủ trên cả hai ngôn ngữ tiếng Anh và tiếng Việt. Phần mềm FiinPro bao phủ thông tin toàn diện về hơn 800 doanh nghiệp niêm yết và 1200 doanh nghiệp đại chúng chưa niêm yết. Ngoài ra, FiinPro còn cung cấp các công cụ phân tích tiện ích như Phân tích Chiến lược, Sàng lọc Cổ phiếu, Phân tích Thị trường, Khai thác Dữ liệu và nhiều công cụ khác được phát triển nhằm hỗ trợ các chuyên viên phân tích, nhà quản lý quỹ, chuyên viên đầu tư, chuyên viên nghiên cứu, chuyên viên tư vấn tài chính… Phần mềm FiinPro cho phép người dùng tiếp cận với nguồn thông tin tài chính chính xác, toàn diện và cập nhật 24/7, bao gồm:
- Nền tảng phân tích mạnh mẽ được phát triển bởi nhóm các chuyên gia ACCA, CPA và CFA dành cho các nhà đầu tư năng động và chuyên nghiệp;
- Dữ liệu thời gian thực về thị trường chứng khoán Việt Nam, danh mục cổ phiếu quan tâm, biến động ngành và bảng giá trực tuyến với các tính năng sàng lọc cổ phiếu theo ngành, sàn, tăng/giảm;
- Nhóm công cụ phân tích, so sánh, sàng lọc cổ phiếu, phân tích ngành, dự báo lợi nhuận, báo cáo phân tích cùng với hàng trăm chỉ tiêu, biểu đồ, dữ liệu báo cáo tài chính;
- Thông tin tài chính đáng tin cậy và cập nhật nhất, bao gồm báo cáo tài chính theo quý và năm của tất cả các doanh nghiệp niêm yết trên hai sàn HOSE và HNX kể từ ngày niêm yết;
- Bộ 200 chỉ số quan trọng để định giá cổ phiếu, quản trị rủi ro, đo lường thanh khoản thị trường, hiệu quả quản lý, sức mạnh tài chính và khả năng sinh lời;
- Sàng lọc trên toàn thị trường với hơn 250 chỉ tiêu và chỉ hiển thị những cổ phiếu đáp ứng được tiêu chuẩn của người dùng;
- Công cụ phân tích ngành và so sánh ngành theo tiêu chuẩn phân ngành ICB;
- Đánh giá Free Cash Flow và Discount Rate theo mô hình CAPM để định giá cổ phiếu, kiểm tra kết quả theo nhiều phương pháp thu nhập;
- Phương pháp luận tính toán chỉ số và dữ liệu được cân nhắc bởi các chuyên gia CPA và kiểm định độc lập bởi bên thứ ba;
- Dễ dàng cài đặt và sử dụng. Dữ liệu thị trường được cập nhật theo thời gian thực. Thông tin cơ bản và chỉ số tài chính được cập nhật và tính toán trong vòng 30 phút sau giờ giao dịch hàng ngày.
FinnPro phiên bản 1.0.5 đã được xuất bản. Những điểm mới trong phiên bản này:
Dữ liệu Room khối ngoại
Trong phiên bản này, FiinPro® cho phép người sử dụng theo dõi dữ liệu sở hữu nước ngoài được cập nhật hàng ngày, bao gồm tổng room khối ngoại, sở hữu khối ngoại hiện tại và room khối ngoại còn lại của toàn bộ thị trường cùng với biến động theo thời gian thực trên thị trường.
Chỉ tiêu ngoại bảng của Ngân hàng
Bên cạnh các chỉ tiêu chủ yếu thông thường của các báo cáo tài chính, phiên bản 1.0.5 cũng cung cấp các chỉ số tài chính ngoại bảng của ngân hàng, mang đến cái nhìn chi tiết và sâu sắc hơn về tình hình tài chính của các ngân hàng.
Dữ liệu Giao dịch Real-time của Nhà đầu tư nước ngoài bán
Theo kế hoạch của Sở giao dịch chứng khoán HCM, dữ liệu này sẽ được cung cấp trong tháng 5/2016, FiinPro® cho phép người sử dụng có thể theo dõi dữ liệu này real-time trong tính năng Bảng Giá trực tuyến.
Các chỉ tiêu phân tích kỹ thuật cơ bản
Tính năng Phân tích kỹ thuật cũng cung cấp khoảng 35 chỉ số kỹ thuật cho người sử dụng để phân tích các biến động giá
Chỉ số tài chính của thị trường
Cung cấp cái nhìn toàn cảnh về thị trường thông qua các chỉ số thị trường P/E, P/B, Beta, ROE, ROA cho cả hai sàn chứng khoán HOSE và HNX trong tính năng Tổng quan thị trường
Bổ sung tính năng Customer support Online
Với nỗ lực không ngừng nâng cao dịch vụ khách hàng, các nhân viên chăm sóc khách hàng FiinPro® hiện nay có thể kết nối trực tiếp và ngay lập tức với người sử dụng thông qua chức năng chat trên FiinPro®. Bất cứ khi nào người sử dụng có câu hỏi hoặc gặp vấn đề trong quá trình sử dụng FiinPro®, xin vui lòng liên hệ với đội ngũ chăm sóc khách hàng của chúng tôi qua một cú nhấp chuột đơn giản.
Hướng dẫn tải về
Đăng ký
Để sử dụng thành công phần mềm FiinPro, người dùng cần thực hiện các bước sau:
- Truy cập vào cổng thông tin http://fiinpro.com
- Điền vào mẫu đăng ký tại trang đăng ký. Trong vòng 24h, Chuyên viên chăm sóc khách hàng của chúng tôi sẽ liên hệ với quý vị về việc sử dụng phần mềm thử nghiệm.
- Quý vị truy cập vào đường link chúng tôi gửi kèm phản hồi ở bước 2, làm theo hướng dẫn để tải và cài đặt FiinPro.
- Đăng nhập bằng ID và Mật khẩu đã được đăng ký ở bước 2 để dùng phần mềm.
Yêu cầu về hệ thống
FiinPro chạy trên hầu hết các hệ điều hành của Microsoft
Hệ điều hành:
Windows: XP / Vista / 7 / 8 / 8.1 / 2003 / 2008 / 2012
Mac OS X: Sớm cập nhật.
Phần cứng:
Internet: Tốc độ cao (cáp quang/sợi quang)
Memory: 2GB (4GB recommended)
Bộ xử lý: Intel core i3 hoặc tương đương (Khuyến nghị Core i5 hoặc cao hơn)
Dung lượng ổ cứng: tối thiểu 100MB
Hướng dẫn cài đặt
- Tải và cài đặt FiinPro trên máy tính của bạn.
- Quá trình cài đặt sẽ gói gọn chỉ trong một “cú nhấp chuột”.
Hộp thoại cài đặt mở đầu xuất hiện, chọn Run để đồng ý cài đặt:
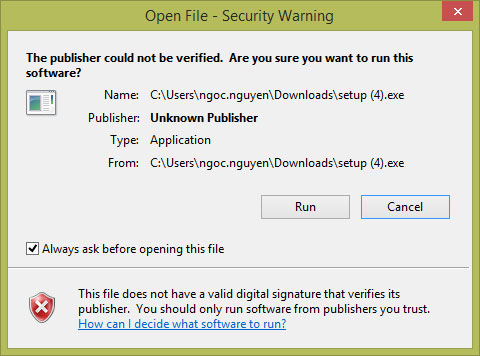
Cài đặt: Mở File
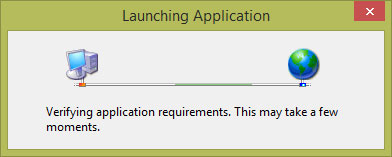
Cài đặt: Quá trình ra mắt ứng dụng
Chọn Install để bắt đầu quá trình cài đặt.
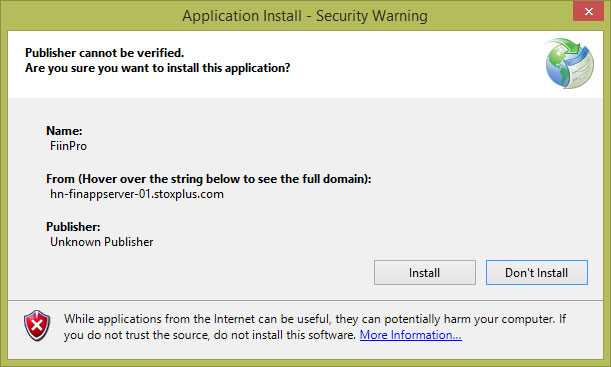
Cài đặt: Cảnh báo an ninh
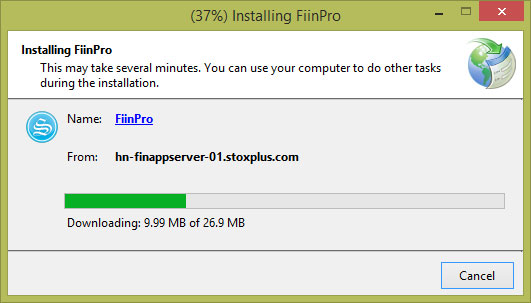
Cài đặt: Đang cài đặt FiinPro
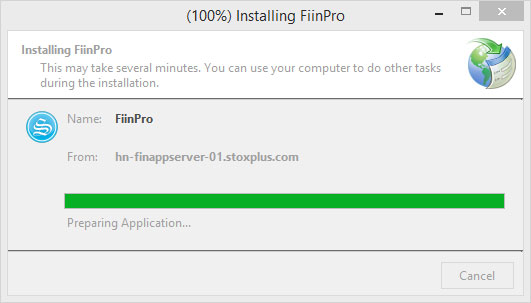
Cài đặt: Hoàn tất quá trình
Lúc này Quý vị đã cài đặt thành công phần mềm FiinPro. Giao diện đăng nhập sẽ hiện ra như hình dưới. Điền thông tin tài khoản của Quý vị để đăng nhập và trải nghiệm sản phẩm của chúng tôi.
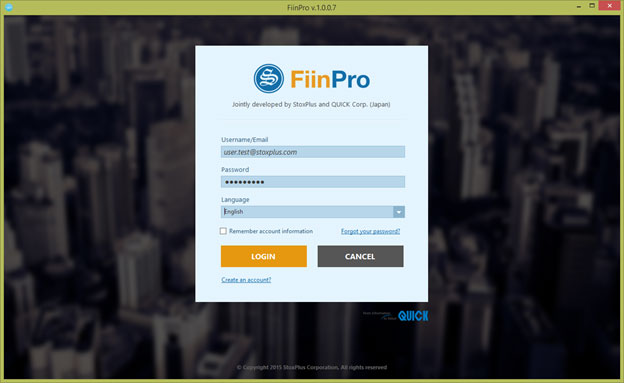
Ra mắt giao diện đăng nhập
Đăng nhập / Thoát ra
Đăng nhập
Mỗi lần Quý vị khởi động ứng dụng sẽ được kiểm tra và cập nhật bản mới nhất (nếu có). Điều này đảm bảo rằng Quý vị đang sử dụng phiên bản phần mềm mới nhất của chúng tôi.
-
Khởi động ứng dụng bằng cách bấm vào biểu tượng đã được cài đặt trên máy tính của Quý vị, hoặc mở bảng chọn Start và chọn đường dẫn sau:
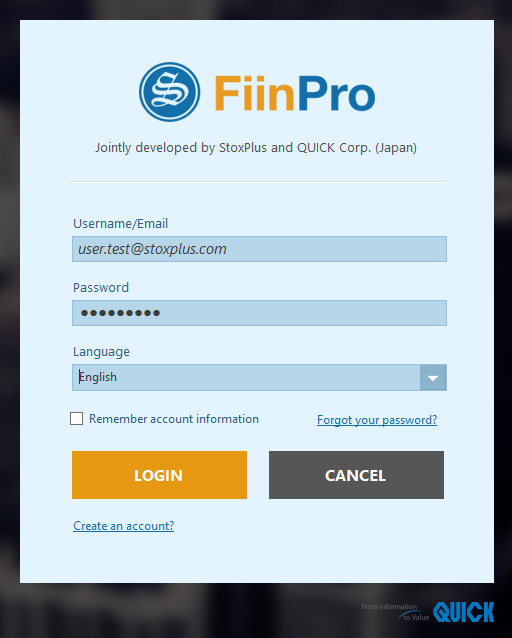
All Programs => StoxPlus Corporation => FiinPro - Nhập Username or Email and Password sau đó chọn lựa ngôn ngữ giữa Tiếng Việt và Tiếng Anh trong hộp thoại.
- Để đăng nhập vào lần kế tiếp, chọn ô Remember Acount Information (chức năng này sẽ ghi nhớ ID và mật khẩu của người dùng vì vậy Quý vị không phải nhập lại nó vào lần sau).
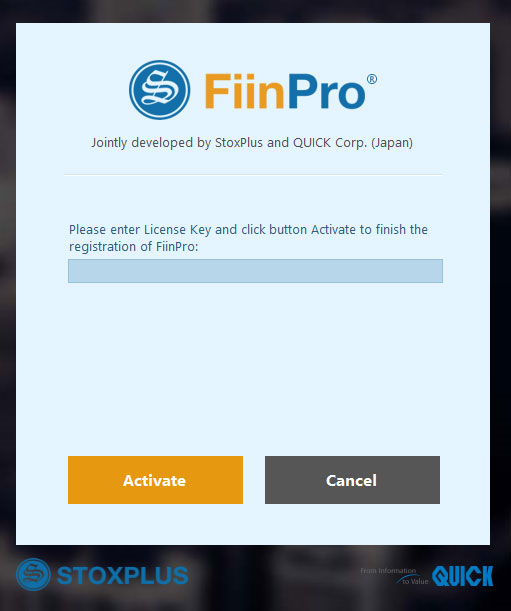
- Sau đó, một hộp thoại kích hoạt sẽ xuất hiện. Vui lòng nhập Key Bản Quyền và kích vào ô Kích hoạt để kết thúc quá trình đăng kí FiinPro. (Mỗi tài khoản sẽ được kích hoạt dưới 1 Key bản quyền duy nhất).
- Chọn Đăng nhập và kết quả là: Ứng dụng đã khởi chạy.
Ghi chú: Quý vị cần kết nối Internet để khởi chạy FiinPro và nhận dữ liệu vào ứng dụng.
Thoát ra
Vì mục đích an ninh, chúng tôi khuyên Quý vị nên thoát khỏi phần mềm mỗi lần kết thúc phiên làm việc của mình. Các workspaces (workspaces) của Quý vị cũng sẽ được lưu lại tại thời điểm làm việc cuối cùng.
To Sign out
Có 3 cách để thoát khỏi ứng dụng:
- Đóng ứng dụng bằng cách kích vào biểu tượng X ở góc trên bên phải của màn hình; hoặc
- Kích chuột phải vào biểu tượng
 ở góc trên bên trái của ứng dụng, và chọn Đóng (Alt +F4); hoặc
 - Kích chuột phải vào biểu tượng FiinPro trên Thanh công cụ Taskbar sau đó kích Đóng cửa sổ(Close Window).
Đổi mật khẩu
- Chọn Cài đặt => Tài khoản của tôi. Thông tin tài khoản của Quý vị sẽ hiển thị.
- Chọn Đổi mật khẩu.
- Nhập mật khẩu hiện tại vào ô “Mật khẩu cũ” và mật khẩu mới vào ô “Mật khẩu mới” và nhập lại vào ô “Xác nhận mật khẩu mới”.
- Chọn gửi
Quên mật khẩu
Trong trường hợp Quý vị không nhớ được mật khẩu mình đã thiết lập, chọn “Quên mật khẩu”. Hệ thống của FiinPro sẽ tự động gửi một mật khẩu truy cập mới đến địa chỉ email của Quý vị.
Bố trí ứng dụng
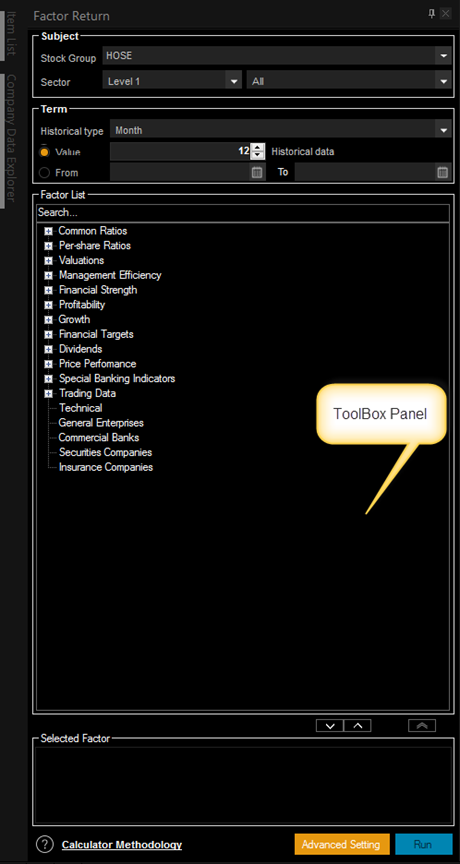
FiinPro có một số yếu tố giúp người dùng dễ dàng sắp xếp các nội dung sử dụng trên màn hình. Dưới đây là một ví dụ về cửa sổ chính:
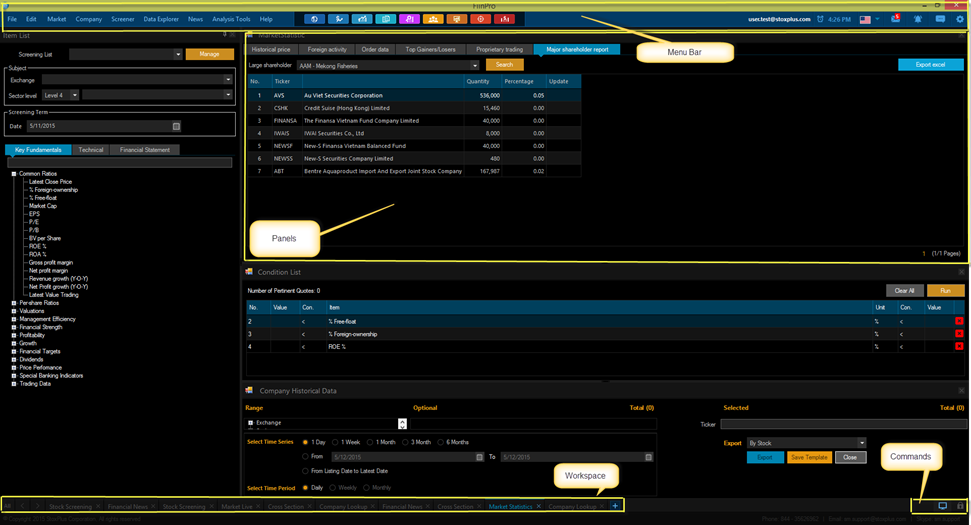
A. Thanh bảng chọn B. Bảng điều khiển C. Vùng làm việc D. Commands
Thanh bảng chọn (Menu Bar)
Menu Bar xuất hiện ở góc trên cùng của ứng dụng.

FiinPro có tất cả 8 nhóm chức năng, với 2 nhóm chức năng cơ bản là File, Chỉnh sửa và 6 nhóm chức năng chính được sắp xếp như sau (có thể được bổ sung thêm ở các phiên bản tiếp theo):

File bao gồm các tính năng cơ bản như Mở, Đóng cửa sổ, Lưu, Lưu thành, hoặc Thoát.
Chỉnh sửa cho phép Quý vị có thể Tạo đa cửa sổ, Tạo nhóm cổ phiếu, Làm mới dữ liệu và Tùy chỉnh.
Thị trường bao gồm các tính năng liên quan tới thị trường như Cập nhật Thị trường, Ngành trực tuyến, Cổ phiếu trực tuyến, Thống kê thị trường và Bảng giá trực tuyến.
Doanh nghiệp hiển thị tất cả thông tin liên quan đến các doanh nghiệp niêm yết và chưa niêm yết, bao gồm Hồ sơ Doanh nghiệp, Báo cáo Phân tích, So sánh với ngành, Báo cáo và Công bố thông tin, Phân tích tài chính,…
Chiến lược Đầu tưcho phép Quý vị Sàng lọc Cổ phiếu và Phân tích Chiến lược dựa trên các điều kiện một cách hiệu quả.
Khai thác Dữ liệu cung cấp cho Quý vị kho dữ liệu về doanh nghiệp, dữ liệu ngành, dữ liệu chỉ số, dữ liệu vĩ mô Việt Nam,…
Tin tức bao gồm tất cả các thông tin về Tin tức Tài chính, Tin Doanh nghiệp, Báo cáo tự động dựa trên nhu cầu của quý vị.
Công cụ phân tích cung cấp các công cụ mang tính phân tích như Contribution Analysis và Cross Section.
Các nút truy cập nhanh

Trên góc trên cùng của ứng dụng, Quý vị có thể nhìn thấy hộp công cụ với các biểu tượng đặc trưng cho mỗi chức năng theo thứ tự từ trái qua phải Tạo nhóm Cổ phiếu, Cập nhật Thị trường, Thống kê Thị trường, Khai thác Dữ liệu, Tìm kiếm Doanh nghiệp, Consensus, Sàng lọc Cổ phiếu, Phân tích Chiến lược, and Dữ liệu vĩ mô Việt Nam. Các biểu tượng này sẽ giúp Quý vị truy cập nhanh đến chức năng mà Quý vị mong muốn.
Các nút khác

Góc trên phải được bố trí một số chức năng như thời gian, chuyển đổi ngôn ngữ, phản hồi, và một số lựa chọn khác.
Bảng điều khiển (Panels)
Panels được đặt trên không gian sử dụng. Mỗi panel có cài đặt và thuộc tính riêng.
Không gian làm việc (workspaces)
Tất cả workspaces của Quý vị đều có thể truy cập từ góc bên dưới bên trái của ứng dụng. Nhấp chuột vào bất kì một tab nào mà bạn muốn hiển thị nó trên panel. Các thiết lập mặc định được hiển thị đầy đủ. Kích đúp chuột vào bất kì một tab nào để đổi tên của tab đó. Hơn nữa, bằng cách kích và di chuyển bất kì tab nào bạn muốn thì workspace sẽ bật ra như một cửa sổ riêng biệt. Quý vị có thể xóa workspace bằng cách kích vào dấu X ở tab hoặc tạo thêm một cửa sổ mới.
Workspace hiện thời (chỉ duy nhất một cái được hiển thị) được xác định bởi thanh màu xanh ở đầu trang.
Các lệnh phổ biến
Nút có biểu tượng khóa ở góc phải dưới của màn hình ứng dụng cho phép Quý vị điều khiển việc chuyển đổi giữa việc khóa hoặc mở workspace.
Dữ liệu thời gian thực và Dữ liệu trễ
Tài khoản của Quý vị đã được cấu hình để hiển thị một cách chính xác các số liệu trong thời gian thực. Tất cả các dữ liệu giá khác được chuyển đổi với một độ trễ nhất định (Dữ liệu thị trường: 60 phút; Dữ liệu hàng hóa và các Chỉ số thế giới: được cập nhật vào cuối ngày).
Các phím tắt
FiinPro có các phím tắt để giúp Quý vị tiết kiệm thời gian trong khi thao tác trên ứng dụng. Các phím tắt này có thể được tìm thấy bằng cách kích vào biểu tượng  Options Menu (ở góc trên phải của ứng dụng) và chọn Trợ giúp.
Bảng danh sách các phím tắt bao gồm:
- Alt + F4 | Thoát FiinPro Platform
- Ctrl + G | Tạo nhóm cổ phiếu
- Ctrl + L | Load a Layout
- Ctrl + N | Create New Layout
- Ctrl + O | Open a Layout
- Ctrl + S | Save Layout
- Ctrl + T | Create a New tab
- Ctrl + W | Close current tab
- Ctrl + Alt + P | Tùy chỉnh danh sách ưa thích
- Ctrl + Alt + R | Làm mới dữ liệu
- Ctrl + Shift + A | Đa cửa sổ
- Ctrl + Shift + C | Đóng cửa sổ
- Ctrl + Shift + S | Save Layout as a diffirent place
- F2 | Phím tắt của chức năng Thị trường trực tuyến
- F3 | Phím tắt của chức năng Thống kê cuối ngày
- F4 | Phím tắt của chức năng Dữ liệu doanh nghiệp
- F5 | Phím tắt của chức năng Tìm kiếm doanh nghiệp
- F6 | Phím tắt của chức năng Consensus
- F7 | Phím tắt của chức năng Sàng lọc cổ phiếu
- F8 | Phím tắt của chức năng Phân tích chiến lược
- F9 | Show StoxPlus Templates
Bảng chọn
Chức năng này cho phép Quý vị thiết lập một số cấu hình cơ bản. Thêm vào đó, Quý vị có thể thấy tất cả các thông tin mà mình muốn tìm kiếm về FiinPro ở đây.
Hỗ trợ trực tuyến
Trong quá trình dùng FiinPro, nếu Quý vị có bất kì câu hỏi nào liên quan đến kỹ thuật hoặc thao tác sử dụng, Quý vị có thể gửi yêu cầu hỗ trợ trực tiếp từ FiinPro. Khi Quý vị phản hồi với chúng tôi, ứng dụng sẽ đính kèm những dữ liệu quan trọng để giúp chúng tôi hỗ trợ Quý vị tốt hơn và từ đó có thể phản hồi cho vấn đề mà Quý vị đang gặp phải một cách chính xác và nhanh nhất.
- Kích vào nút Đóng góp ý kiến
 ở góc trên bên phải của ứng dụng;
 - Trong ô Đóng góp ý kiến, nhập mô tả về vấn đề mà Quý vị đang gặp phải, hoặc câu hỏi mà Quý vị đề cập cho chúng tôi;
- Nếu thông tin về số điện thoại mà Quý vị cung cấp cho chúng tôi trong quá trình đăng kí tài khoản FiinPro không phải là số Quý vị đang sử dụng nữa, làm ơn hãy sửa lại kèm theo phản hồi này;
- Nếu vấn đề mà Quý vị đang gặp phải có thể nhìn trực quan qua workspaces, Quý vị có thể chụp lại ảnh màn hình, và gửi kèm cho chúng tôi cùng với kiến nghị. Điều này sẽ rất hữu ích cho đội kĩ thuật khi được nhìn thấy trực tiếp vấn đề của Quý vị;
- Kích Gửi.
Quý vị cũng có thể tìm thấy hỗ trợ trực tuyến bằng cách kích vào nút lựa chọn sau đó chọn Trợ giúp.
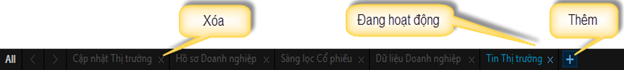
WorkSpaces
Một workspace được sử dụng để lưu trữ và sắp xếp tất cả các nội dung mà bạn muốn xem. Một workspace có thể chứa các panels – cửa sổ với các dữ liệu cụ thể như bảng báo giá, biểu đồ, tin tức,…
Workspace được truy cập bằng cách sử dụng “các thẻ (tabs)” nằm dọc ở phần dưới tính từ bên trái của ứng dụng. Một khi bạn mở một workspace nào, màu của thẻ đó sẽ thay đổi sang màu xanh để chỉ ra trạng thái là workspace đó đang hoạt động.
Workspace sẽ được tự động chia ra chiều ngang hoặc chiều dọc để thêm các panels. Một khi các panels này được thêm vào, Quý vị có thể điều chỉnh kích thước của panels trên workspace bằng cách di chuyển các cạnh.
Đặt lại tên cho workspace
- Kích đúp chuột vào thẻ mà Quý vị muốn đặt tên lại. (Thẻ workspaces được đặt ở góc dưới bên trái của ứng dụng).
Kết quả: Tên workspace sẽ được bôi đậm - Gõ lại tên, sau đó nhấn Enter để hoàn thành.
Thêm mới workspace
Có 3 cách để thêm mới một workspace:
-
Kích vào biểu tượng
 (được đặt ở góc dưới bên phải của các workspaces).
Kết quả: Một workspace trống xuất hiện, cho phép Quý vị mở một chức năng mới bất kì; hoặc - Kích chuột phải vào bất kì một Workspace tab nào, sau đó chọn Thẻ mới; hoặc
- Nhấn Ctrl + T
Xóa một workspace
Kích vào nút  hiển thị trên tab mà bạn muốn xóa. (Workspace tabs được đặt trên góc dưới trái của ứng dụng).
Kết quả: Workspaces và tất cả các panelss chứa trong nó được xóa thành công.
Các lệnh chuột phải
Kích chuột phải vào bất kì một workspace tab nào để xem các lựa chọn thêm. Các lựa chọn bao gồm:
Lựa chọnMô tả
Thẻ mớiCho phép Quý vị tạo một workspace mới
Tải lạiCho phép Quý vị tải lại dữ liệu của thẻ hiện tại
Nhân đôiMở một thẻ mới với nội dung tương tự thẻ đang dùng
Xem trên cửa sổ khácChuyển thẻ hiện tại sang một cửa sổ mới dạng pop-up
Đóng thẻĐóng thẻ hiện tại
Đóng các thẻ khácĐóng tất cả các thẻ trừ cái hiện tại
Đóng thẻ từ bên phảiĐóng các thẻ lần lượt từ phải sang trái
Đóng tất cả các thẻĐóng tất cả các thẻ chỉ với 1 cú nhấp chuột
Khóa nội dung của workspace
Một khi Quý vị đã sắp xếp lại các panelss trong workspace của mình, Quý vị có thể muốn Khóa nội dung đó để tránh những thay đổi cho lần truy cập sau.
Hai nấc khóa
 Khóa: Các việc chia tách giữa các panels bị khóa. Quý vị không thể thay đổi kích thước hoặc di chuyển panels trong workspace, thêm mới panels vào workspace, hoặc xóa panels từ workspace.
 Mở khóa: Panels có thể được thêm, xóa, di chuyển trên workspace.
Khóa/Mở khóa workspace
Kích vào biểu tượng Khóa ở góc dưới bên phải của workspace, cho đến khi biểu tượng thay đổi đến trạng thái mong muốn của Quý vị.
Lưu/Khôi phục lại workspace
Khi Quý vị thoát khỏi ứng dụng, lần truy cập tiếp theo sẽ mở lại workspace với các chức năng từ lần truy cập trước ứng với từng tài khoản của Quý vị. (Giả dụ Quý vị đang dùng lớn hơn 02 tài khoản).
Bảng làm việc (Panels)
Các loại Panels
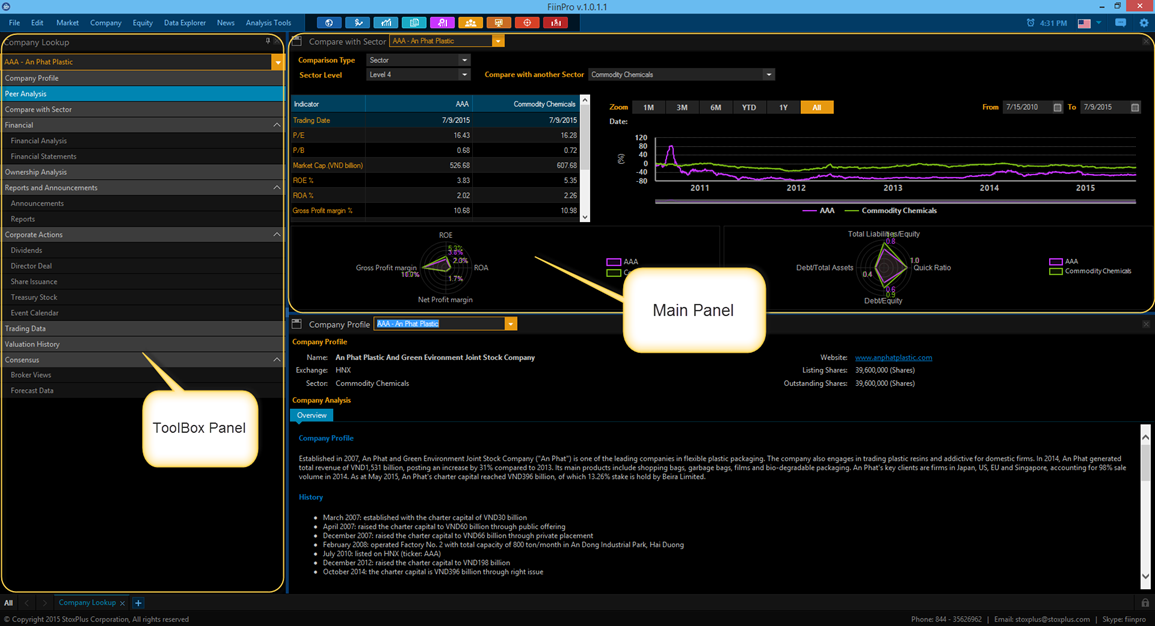
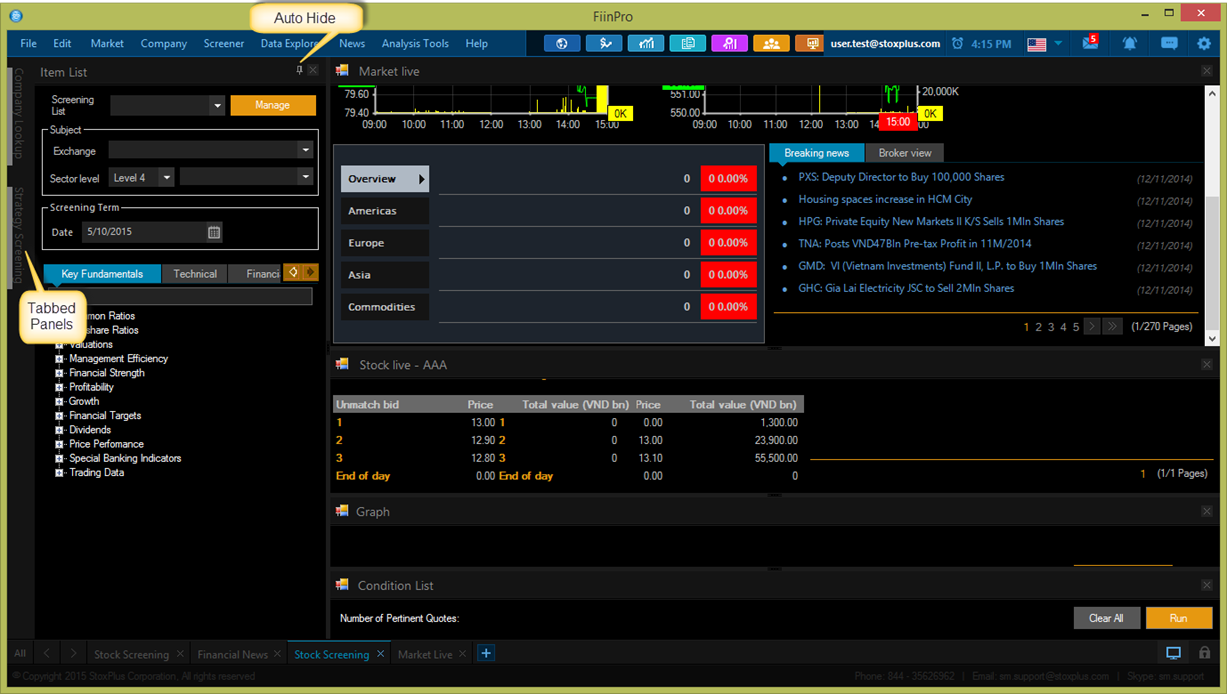
Một panel nói đơn giản chỉ là một bảng riêng biệt được đặt vào workspace của Quý vị và chứa nội dung dữ liệu thị trường cụ thể. Mỗi panels có các tính chất, đặc điểm và nội dung riêng của nó. Panels của FiinPro bao gồm hai loại: Panel chính và Toolbox panel (Bảng hộp công cụ). Điều khác biệt giữa chúng là toolbox panel có thêm chức năng Ẩn tự động và một tabbed panel mà không có trong Panel chính.
Thêm/Xóa một Panel
FiinPro tự động tối đa hóa không gian màn hình sẵn có khi Quý vị thêm một panel vào workspace. Không cần phải sắp xếp nhiều cửa sổ để có được một cái nhìn tối ưu cho workspace của bạn. Khi Quý vị thêm các panel mới, workspace sẽ tự động điều chỉnh cho phù hợp với nội dung.
Thêm mới một Panel
- Dùng tổ hợp phím Ctrl + Shift + Ahoặc chọn Chỉnh sửa -> Đa cửa sổ, ở góc trên bên trái của ứng dụng để mở Danh sách các tính năng.
- Từ Danh sách các tính năng, chọn bất kì một tính năng nào bạn muốn thêm vào workspace, và kích vào đó.
Ghi chú: Bảng hộp công cụ chỉ áp dụng được cho Tìm kiếm doanh nghiệp, Sàng lọc cổ phiếu, Phân tích chiến lược, Dữ liệu doanh nghiệp và Dữ liệu giao dịch ngành/chỉ số.
Xóa một Panel
Để xóa một Panel, chọn ở góc trên bên phải của panel muốn xóa.
Di chuyển Panel
Điều chỉnh Panel
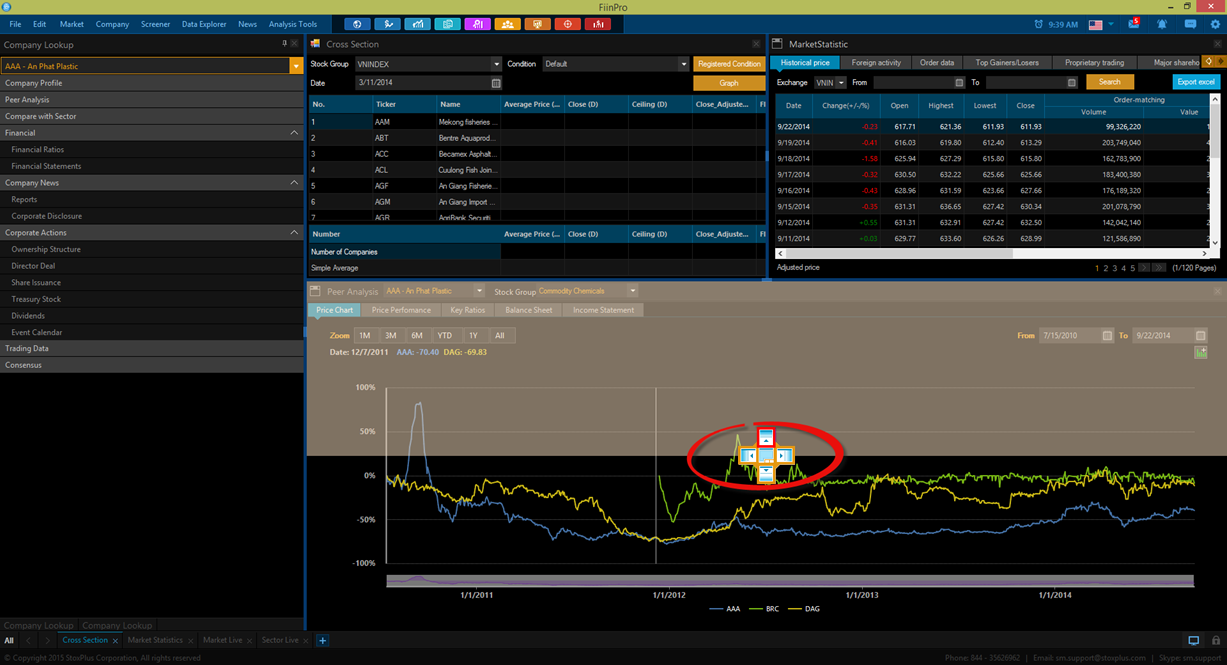
Quý vị có thể di chuyển vị trí của panels (sang vị trí mới thẳng đứng hoặc nằm ngang) bằng cách kích chuột vào thanh tiêu đề của panels và giữ. (Toàn bộ panels được đánh dấu, và con trỏ chuyển thành mũi tên 4 chiều như hình minh họa bên dưới). Sử dụng chuột, kéo và thả panel vào vị trí mong muốn.
Tiêu đề của Panel
Mỗi panel có tên riêng chỉ chức năng của mình ở góc trên bên trái.

Tabbed Panels
Tabbed Panel cho phép bạn tạo nhiều thẻ với nội dung khác nhau. Ví dụ một workspace có thể chứa nhiều tab với bất kì nội dung nào. Tabbed panel đặc biệt hữu ích khi Quý vị vừa muốn có thêm nhiều nội dung mới ở trong một workspace mà vẫn muốn bảo toàn những nội dung cũ.
Thêm một Tabbed panel mới
- 1. Dùng tổ hợp phím Ctrl + Shift + A hoặc chọn Chỉnh sửa -> Đa cửa sổ,ở góc trên bên trái của ứng dụng để mở Danh sách các tính năng.
- Từ Danh sách các tính năng, chọn bất kì một tính năng nào bạn muốn thêm vào workspace, và kích vào đó.
- 3. Tự động ẩn thẻ điều khiển mới bằng cách kích vào biểu tượng
 ở góc trên bên phải của panel.
Di chuyển một Tabbed Panel
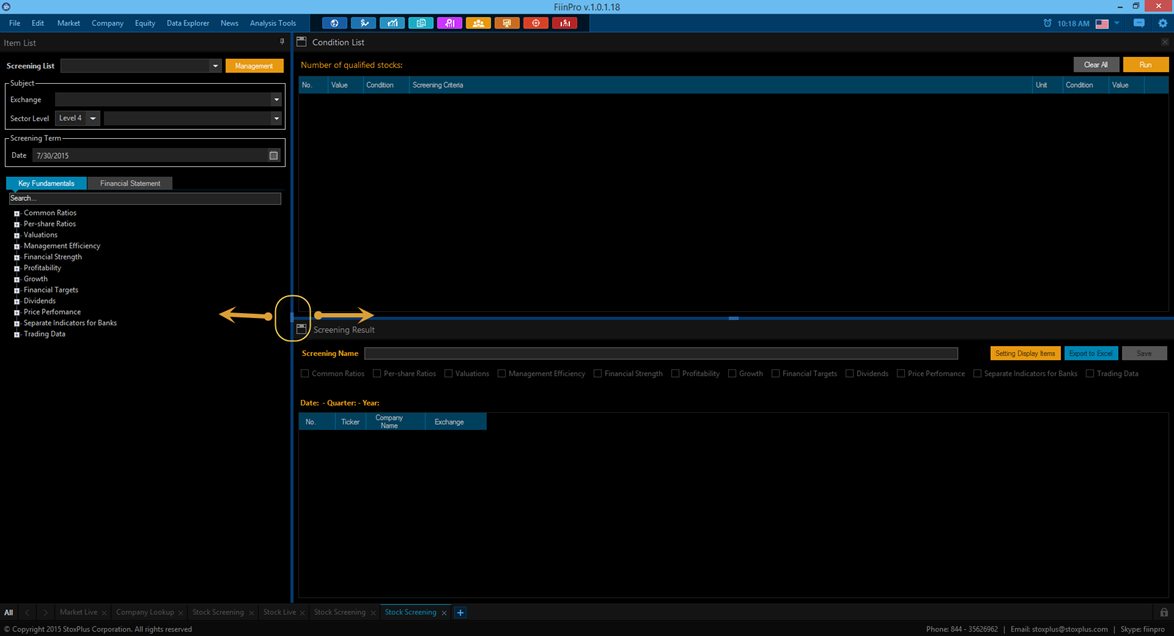
Quý vị có thể điều chỉnh độ rộng của tabbed panel bằng cách điều chỉnh biểu tượng nằm dọc đường kẻ như trong hình, sang bên trái hoặc sang bên phải, áp dụng cho các chức năng sau:
- Doanh nghiệp/ Tìm kiếm doanh nghiệp
- Chiến lược đầu tư/ Sàng lọc cổ phiếu
- Chiến lược đầu tư/ Phân tích chiến lược
- Chiến lược đầu tư/ Phân tích nâng cao
- Dữ liệu/ Dữ liệu Doanh nghiệp
- Dữ liệu/ Dữ liệu Ngành-Chỉ số
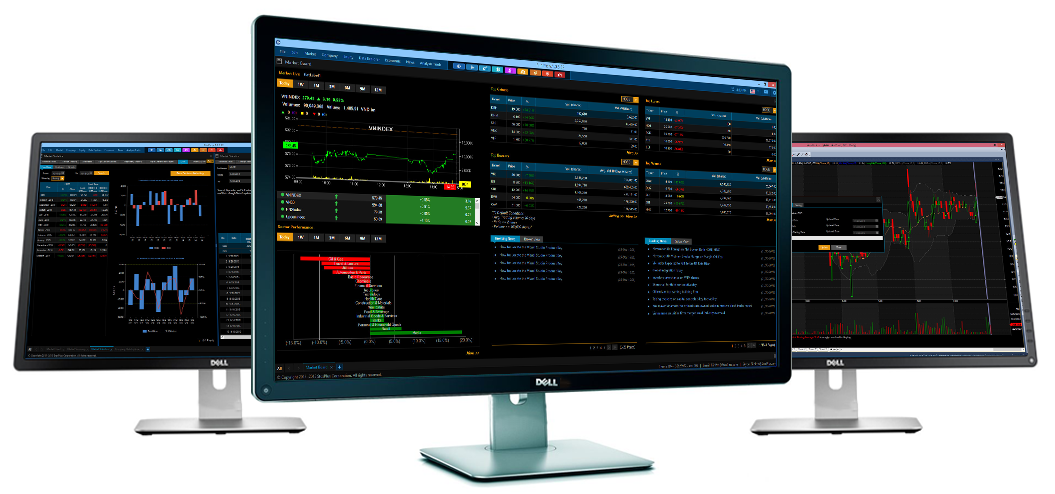
Đa giao diện màn hình
Về hiển thị
Hiển thị thêm nhiều màn hình
Quý vị có thể tạo và quản lý đa giao diện màn hình trong ứng dụng, cho phép Quý vị có thể di chuyển mỗi cửa sổ hiển thị riêng biệt mà vẫn có thể kết nối với ứng dụng. Ví dụ nếu môi trường làm việc của Quý vị là hai màn hình máy tính được kết nối với một màn hình chính là ba màn hình, Quý vị có thể tạo ra ba cửa sổ hiển thị, hoặc ba workspaces, và di chuyển mỗi cửa sổ đó đến mỗi màn hình máy tính riêng biệt.
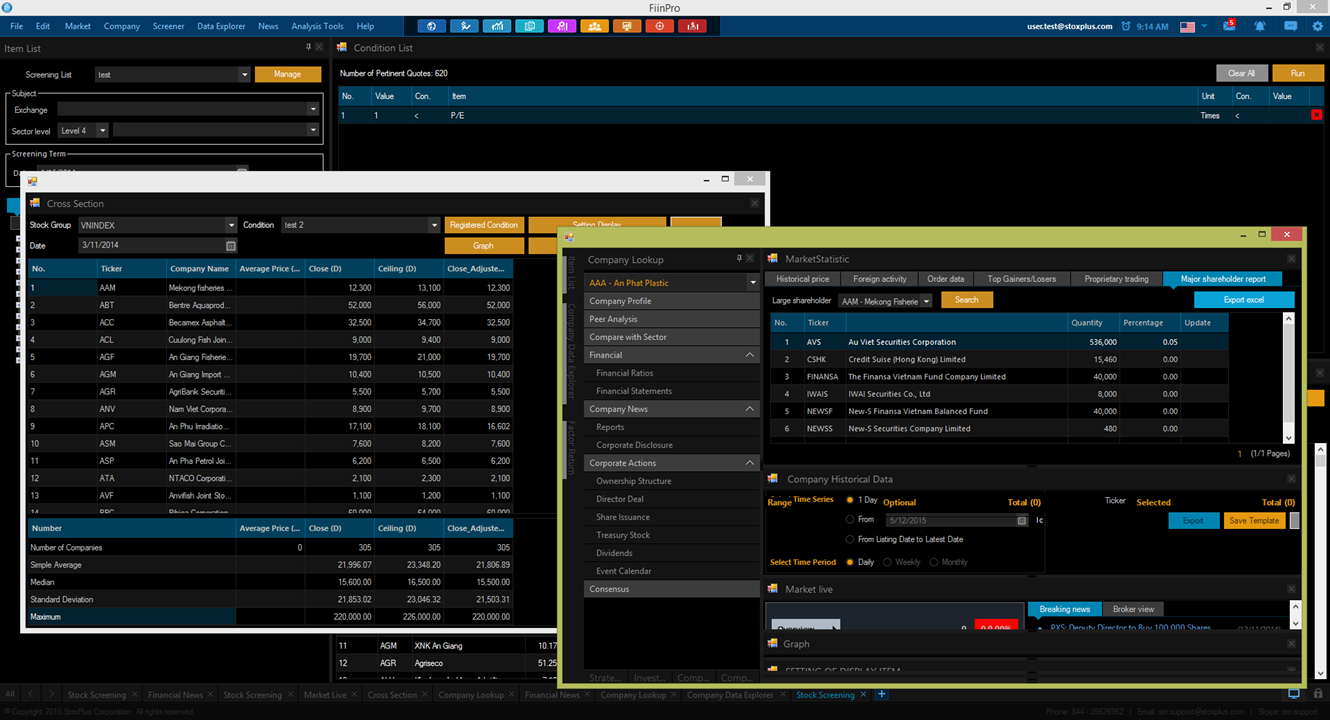
Màn hình hiển thị mới thường trống khi được mở. Quý vị có thể thêm mới workspace cho nó bằng cách thủ công, hoặc Quý vị có thể di chuyển một số workspace đang được dùng vào đó.
Xóa màn hình hiển thị
Khi Quý vị xóa một cửa sổ hiển thị, Quý vị có thể tùy chọn chuyển tất cả các workspaces vào các cửa sổ ứng dụng chính. Nếu Quý vị không di chuyển chúng, tất cả nội dung hiển thị sẽ bị xóa.
Tùy chỉnh
Tùy chỉnh là một trong số những tiện tích mà chúng tôi mang đến cho quý vị ở nền tảng FiinPro. FiinPro được phát triển với mục đích cung cấp dữ liệu và thông tin cho các nhà quản lý quỹ, các chuyên viên phân tích, các nhà nghiên cứu, các nhà đầu tư… Vì vậy, chúng tôi đã xây dựng một số Hồ sơ người dùng để giúp người dùng có được cái nhìn tổng quan về phần mềm trong những lần sử dụng đầu tiên. Quý vị có thể chọn Hồ sơ thích hợp và sử dụng những chức năng liên quan ở trong cùng một tab. Quý vị vui lòng làm theo các bước sau để mở chức năng:
- Vui lòng chọn Chỉnh sửa -> Tùy chỉnh -> Quản lý Tài Khoản
- Chọn một Hồ sơ người dùng.
- Kích Mở nếu quý vị chỉ muốn sử dụng các chức năng liên quan đến hồ sơ đó tại một thời điểm nhất định.
- Kích Lưu nếu quý vị muốn lưu Hồ sơ cho lần truy cập tiếp theo.
- Kích Hủy nếu quý vị muốn đóng cửa sổ.
Bao gồm 2 tabs:
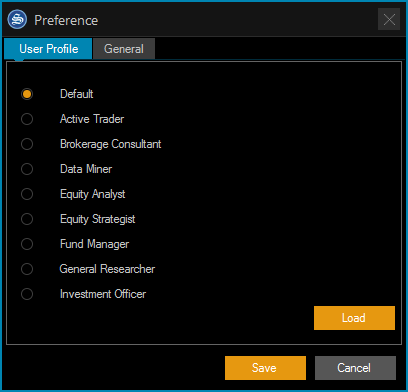
Tab 1 - Quản lý tài khoản
1. Mặc định
Khi quý vị chọn định dạng này, màn hình workspace sẽ tự động trở về trạng thái mặc định của phần mềm.
2. Nhà đầu tư
Bao gồm các chức năng:
- Cập nhật Thị trường
- Cổ phiếu trực tuyến
- Ngành trực tuyến
3. Tư vấn môi giới
Bao gồm các chức năng:
- Cổ phiếu trực tuyến
- Ngành trực tuyến
4. Chuyên viên dữ liệu
Bao gồm các chức năng:
- Dữ liệu Doanh nghiệp
- Công ty – Báo cáo Tài chính

5. Chuyên viên phân tích
Bao gồm các chức năng:
- Tìm kiếm Doanh nghiệp
- So sánh Doanh nghiệp
- Consensus
6. Chuyên viên chiến lược
Bao gồm các chức năng:
- Phân tích Chiến lược
- Thống kê Thị trường
7. Quản lý quỹ
Bao gồm các chức năng:
- Sàng lọc cổ phiếu
8. Chuyên viên nghiên cứu
Bao gồm các chức năng:
- Tìm kiếm Doanh nghiệp
- Phân tích Tài chính
- So sánh Doanh nghiệp
9. Chuyên viên đầu tư
Bao gồm các chức năng:
- Tìm kiếm Doanh nghiệp
- Báo cáo Tài chính
Tab 2 - Cài đặt chung
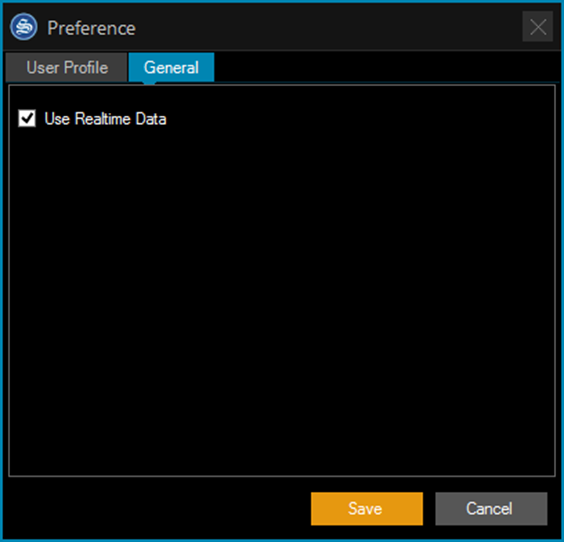
Tại tab Cài đặt chung, người dùng có thể chọn hoặc bỏ chọn ô Sử dụng dữ liệu trực tuyến để tắt/bật tính năng kết nối dữ liệu thời gian thực, được dùng cho một số chức năng như Cập nhật thị trường, Ngành trực tuyến, Cổ phiếu trực tuyến, Bảng giá trực tuyến.
Tạo Nhóm cổ phiếu
Chức năng Tạo Nhóm cổ phiếu cho phép Quý vị tùy chỉnh các nhóm cổ phiếu mà mình quan tâm và sử dụng chúng làm điều kiện đầu vào cho các chức năng khác của phần mềm.
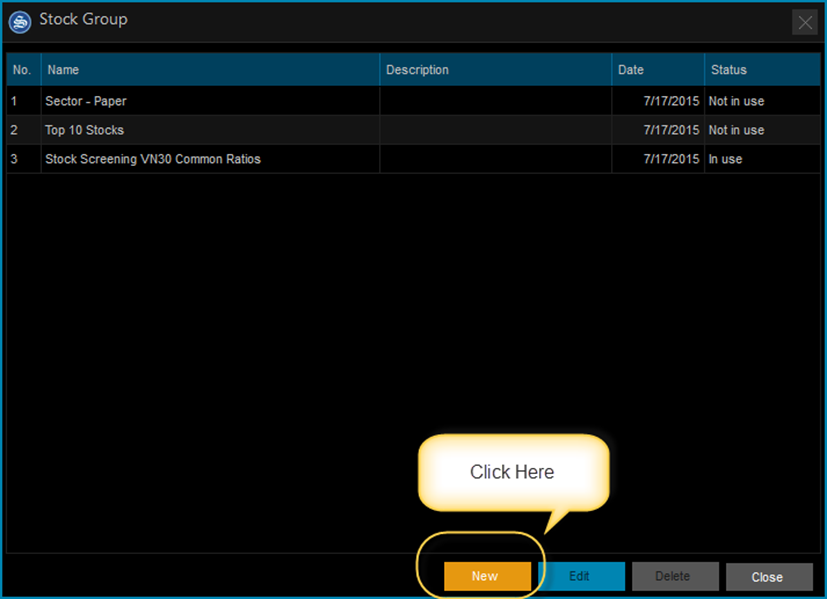
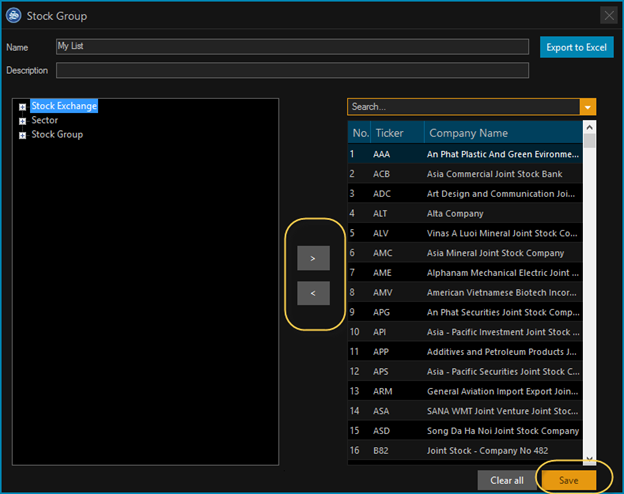
Tạo một Nhóm cổ phiếu mới
- 1. Mở chức năng Tạo Nhóm cổ phiếu
- Kích nút Tạo mới => Nhóm cổ phiếu xuất hiện
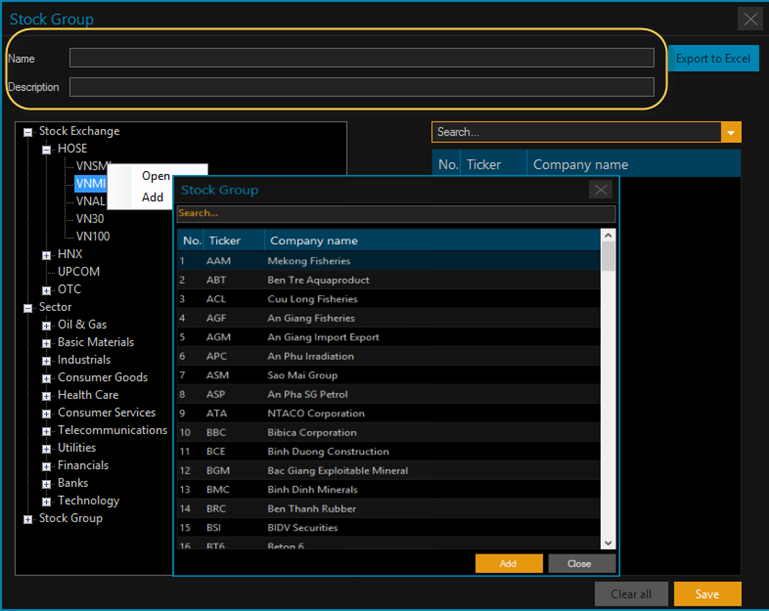
- Điền "Tên" và "Mô tả" cho nhóm cổ phiếu mới của Quý vị
-
Điền các mã cổ phiếu vào nhóm cổ phiếu mới bằng hai cách:
- Chọn mã cổ phiếu từ danh sách Thị trường chứng khoán/Ngành bằng cách kích đúp vào Thị trường chứng khoán/Ngành hoặc kích chuột phải vào Thị trường chứng khoán/Ngành để Mở/Thêm.
- Gõ trực tiếp mã cổ phiếu vào cột Tìm kiếm
- Chọn nút Lưu.
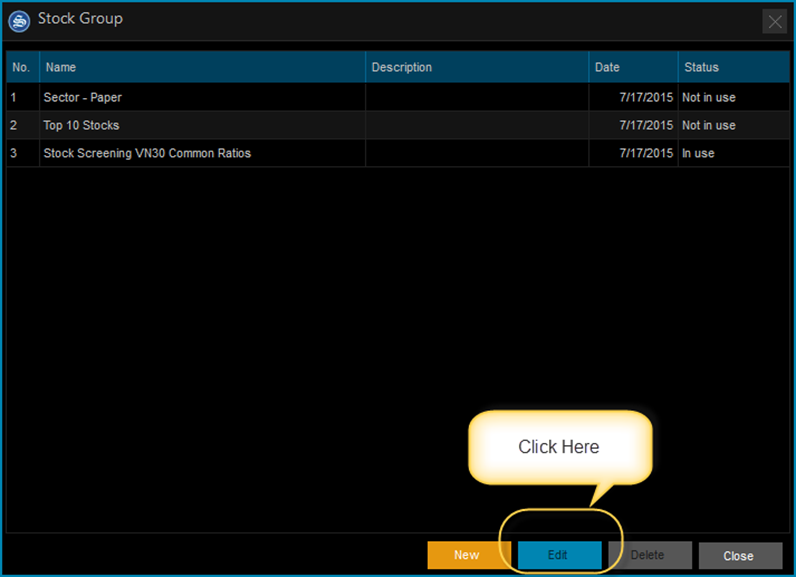
Sửa Nhóm cổ phiếu
- 1. Mở chức năng Tạo nhóm cổ phiếu
- 2. Chọn một nhóm cổ phiếu bất kì mà bạn muốn sửa
- Chọn nút “Chỉnh sửa” => cửa sổ Nhóm cổ phiếu sẽ xuất hiện.
- Thêm/Xóa 4. Thêm/Xóa các mã cổ phiếu từ nhóm cổ phiếu đã chọn
- Chọn “Lưu”.
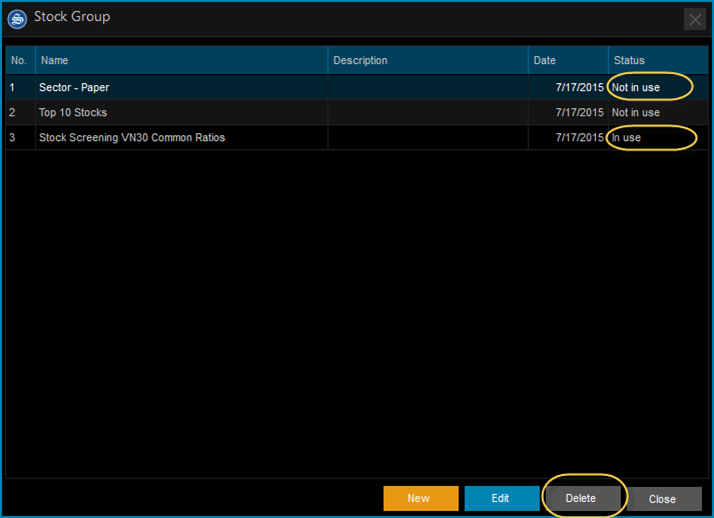
Xóa Nhóm cổ phiếu
Nếu nhóm cổ phiếu của bạn được sử dụng như là một điều kiện đầu vào cho các chức năng khác, trạng thái của nhóm cổ phiếu sẽ chuyển từ “Không sử dụng” sang “Đang sử dụng”.
- Chọn Nhóm cổ phiếu mà bạn muốn xóa
- Chọn nút Xóa.
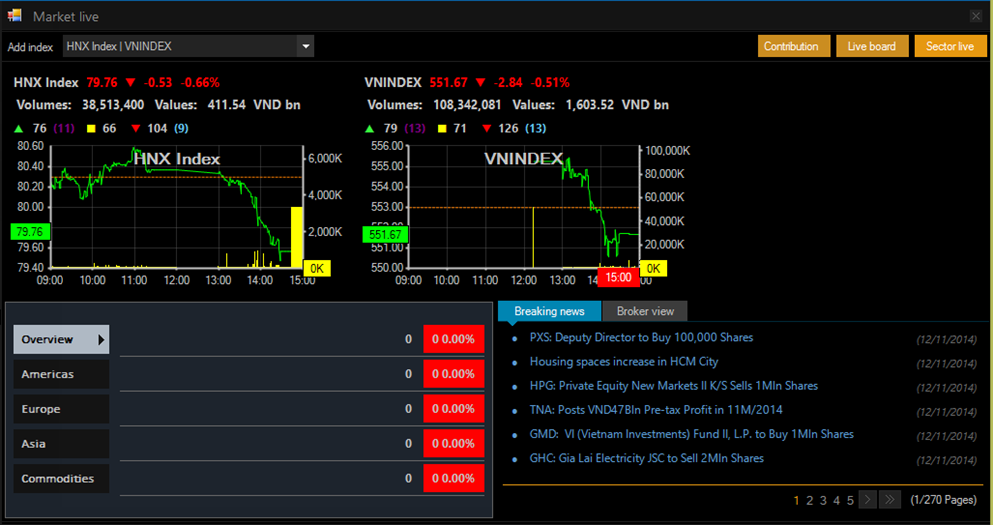
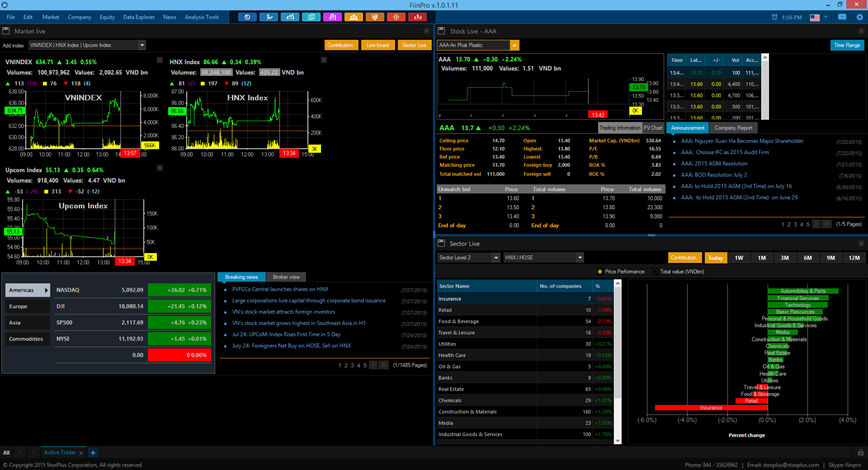
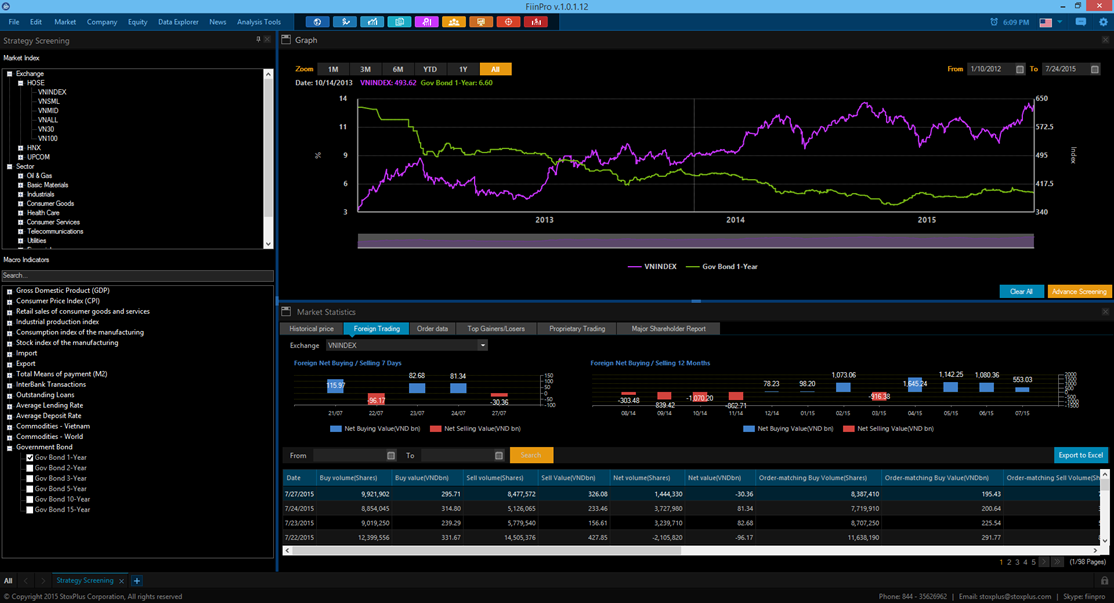
Phân tích Thị trường
Chức năng Phân tích Thị trường hiển thị dữ liệu thời gian thực của các chỉ số, các ngành và cổ phiếu. Chức năng này cũng cung cấp dữ liệu thống kê thị trường như dữ liệu giao dịch nước ngoài, giao dịch tự doanh, thống kê đặt lệnh, lịch sử giá và thông tin cổ đông lớn.
Chuyển động hàng ngày của thị trường
Theo dõi diễn biến thị trường thông qua tính năng Cập nhật Thị trường, Ngành trực tuyến, Cổ phiếu trực tuyến
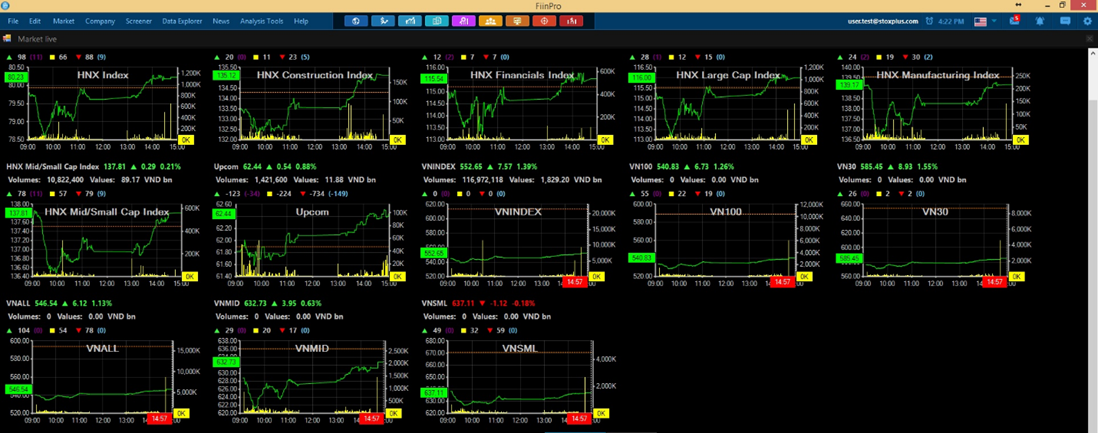
Cập nhật Thị trường
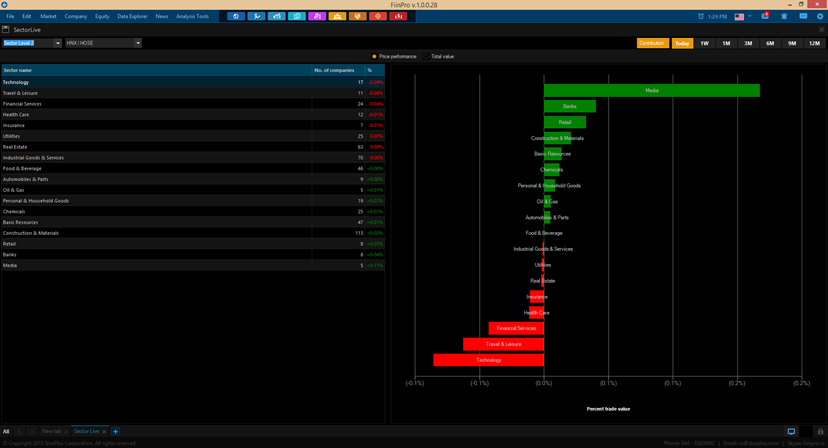
Ngành trực tuyến
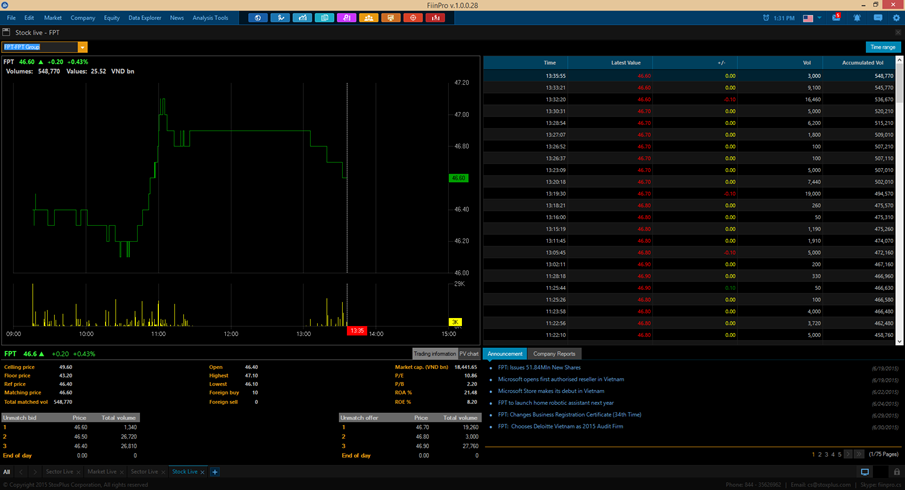
Cổ phiếu trực tuyến
Thống kê Thị trường
Bằng cách kích vào nút “Xuất Excel” Quý vị có thể trích xuất được các dữ liệu thống kê thị trường cuối ngày, bao gồm:
- Lịch sử giá
- Giao dịch Nước ngoài
- Thống kê đặt lệnh
- Top cổ phiếu tăng/giảm
- Giao dịch Tự doanh
- Thông tin cổ đông lớn
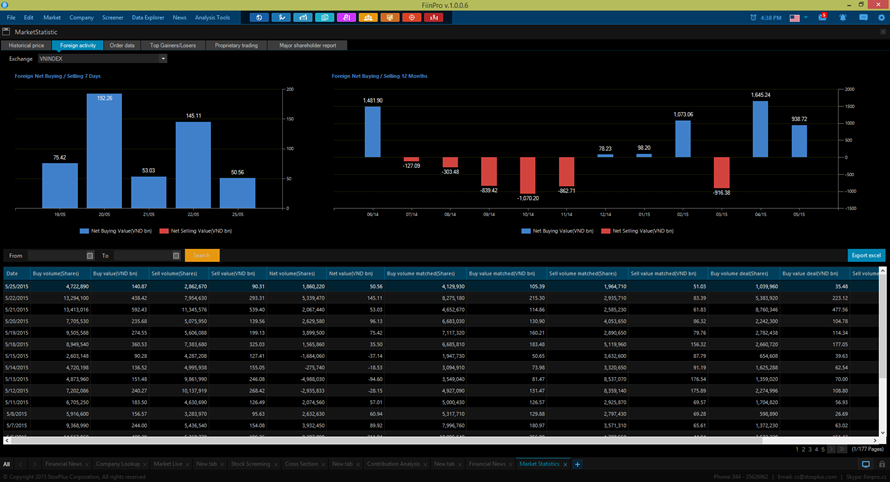
Thống kê thị trường: Giao dịch Nước ngoài
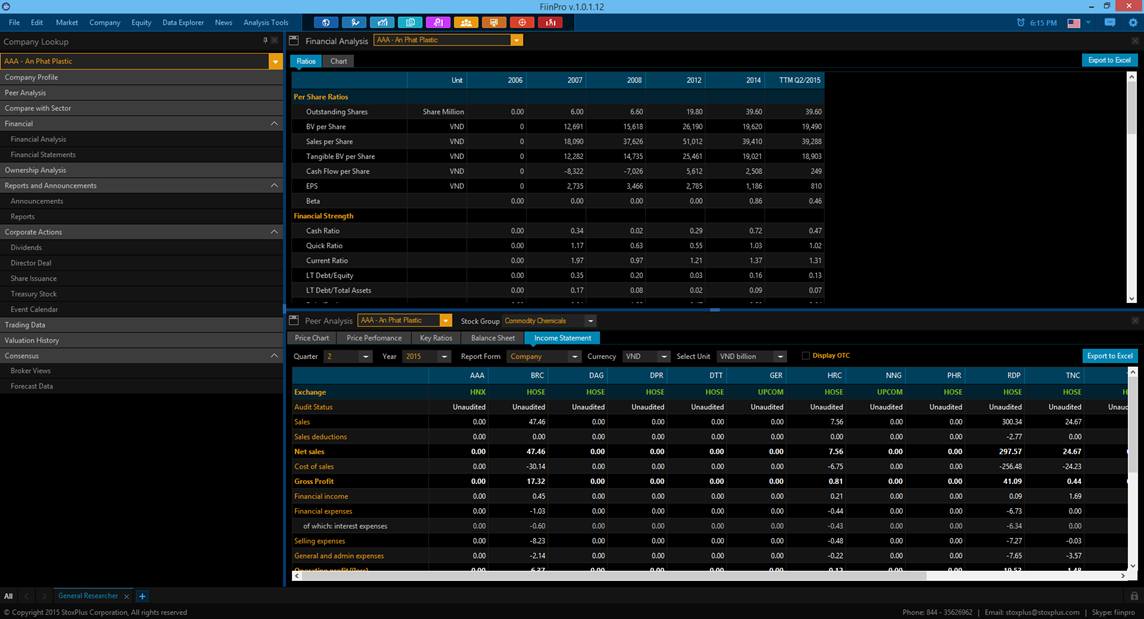
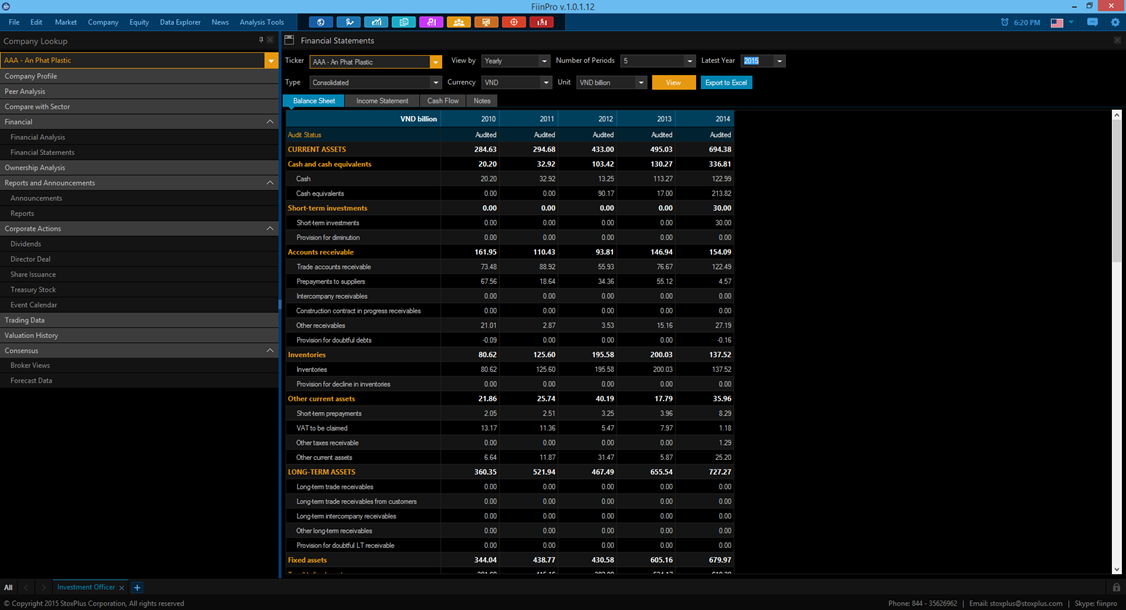
Phân tích Doanh nghiệp
Chức năng Phân tích Doanh nghiệp hiển thị tất cả các thông tin của một doanh nghiệp bao gồm Hồ sơ doanh nghiệp, Phân tích tài chính, Sự kiện doanh nghiệp, Cơ cấu sở hữu, Dữ liệu giao dịch,… để đưa đến cho người dùng một cái nhìn tổng quan về quá trình hoạt động của doanh nghiệp và triển vọng trong tương lai. Chức năng này bao quát hơn 2.000 doanh nghiệp niêm yết ở Việt Nam.
Bên cạnh đó, chức năng này còn cung cấp các công cụ phân tích: So sánh doanh nghiệp, So sánh với ngành; điều này cho phép Quý vị có thể so sánh một doanh nghiệp với 1 doanh nghiệp khác hoặc với ngành khác.
Tìm kiếm doanh nghiệp
Chọn chức năng Tìm kiếm Doanh nghiệp, danh sách các tính năng chi tiét sẽ được hiển thị để quý vị lựa chọn hiển thị các thông tin cần thiết về một doanh nghiệp.
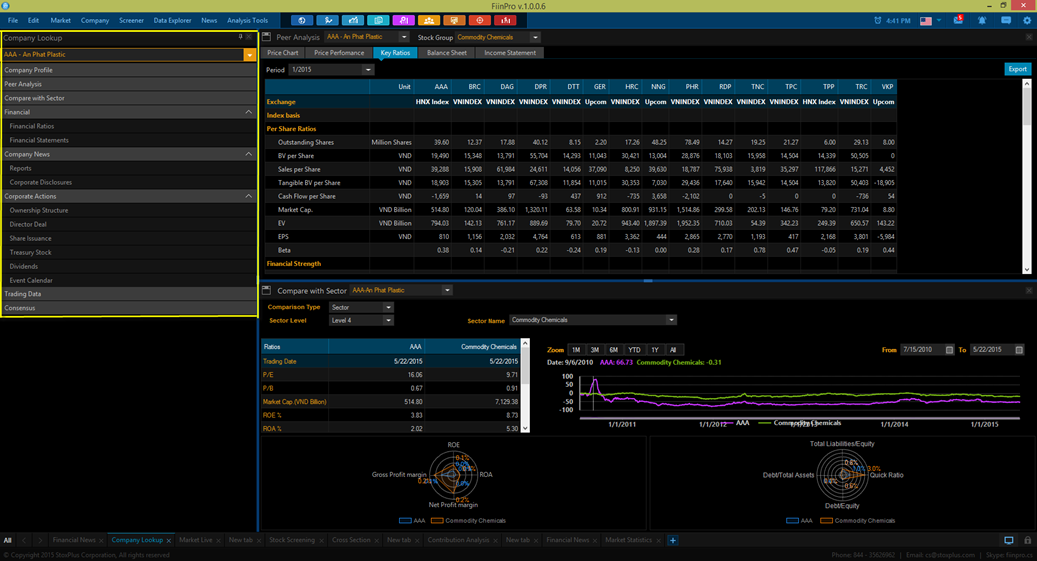
Phân tích Doanh nghiệp: Tìm kiếm Doanh nghiệp
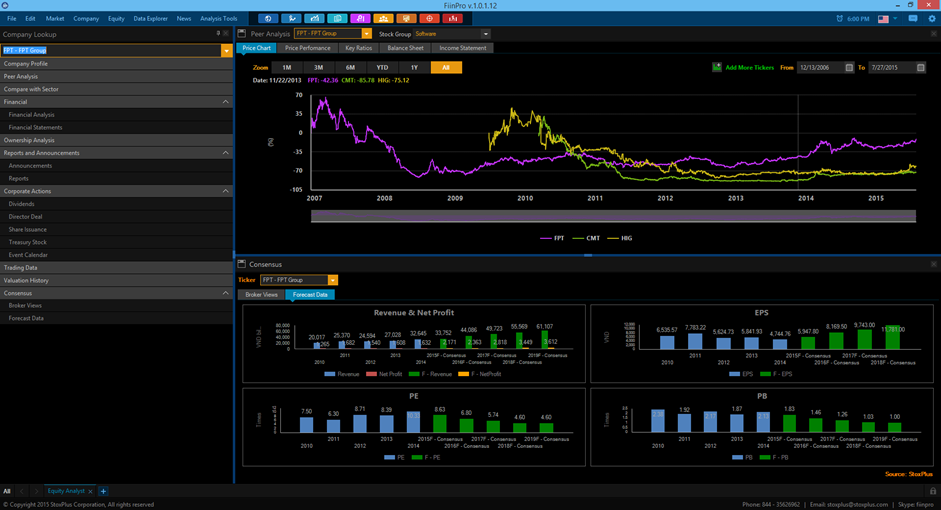
Dữ liệu dự báo
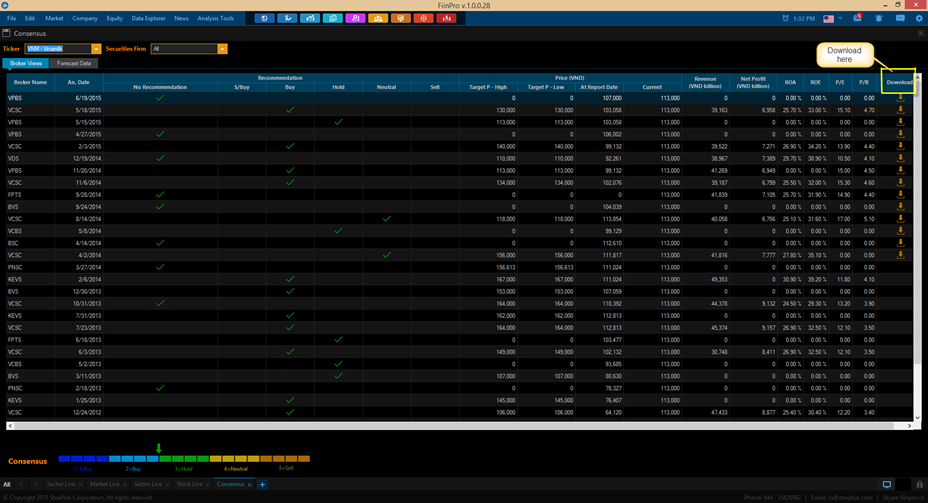
Phân tích Doanh nghiệp: Dữ liệu dự báo
- Chọn Mã chứng khoán và Công ty chứng khoán để xem Góc nhìn Môi giới
- Chọn biểu tượng Tải về để đọc đầy đủ và chi tiết hơn về Góc nhìn Môi giới
- Chuyển sang tab Dữ liệu dự báo để xem dự báo về doanh thu và lợi nhuận ròng, EPS, PE và PB.
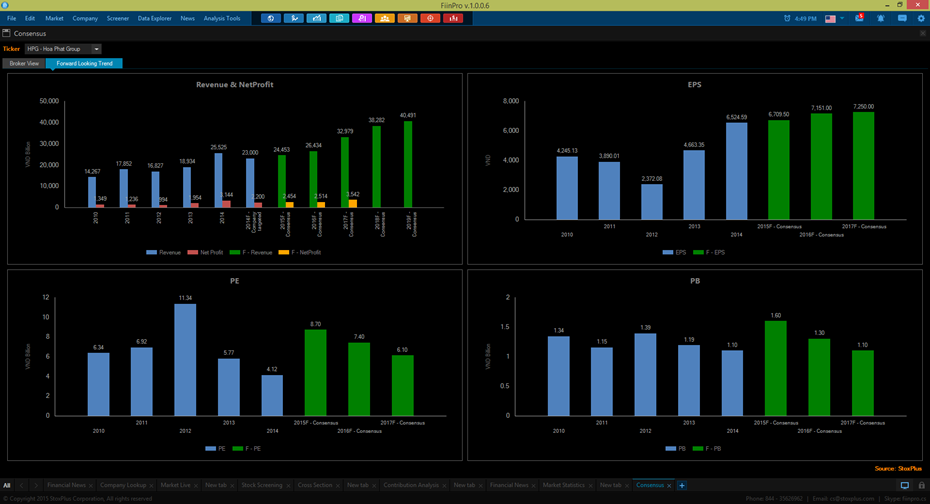
Tìm kiếm doanh nghiệp: Dữ liệu dự báo
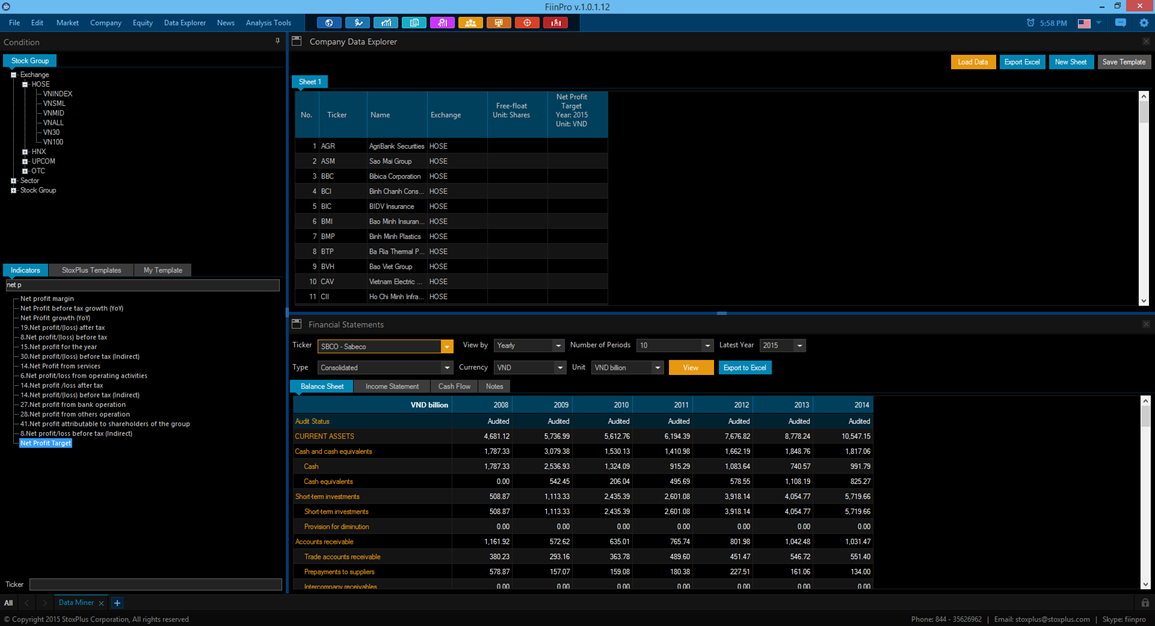
Dữ liệu
Chức năng Dữ liệu cho phép Quý vị thiết kế dữ liệu mẫu và xuất dữ liệu ra thành tập tin excel. Bao gồm gần 2000 các chỉ tiêu cơ bản và gần 1000 các chỉ tiêu vĩ mô Việt Nam.
Bên cạnh đó, Quý vị có thể sử dụng dữ liệu mẫu được thiết kế sẵn bởi StoxPlus như là Dữ liệu ngành ngân hàng, Mô hình định giá, Thống kê cổ tức tiền mặt và đặc biệt là Lịch sử điều chỉnh giá được sử dụng như là yếu tố đầu vào cho một số công cụ kỹ thuật như là Meta Stock, Ami Brocker.
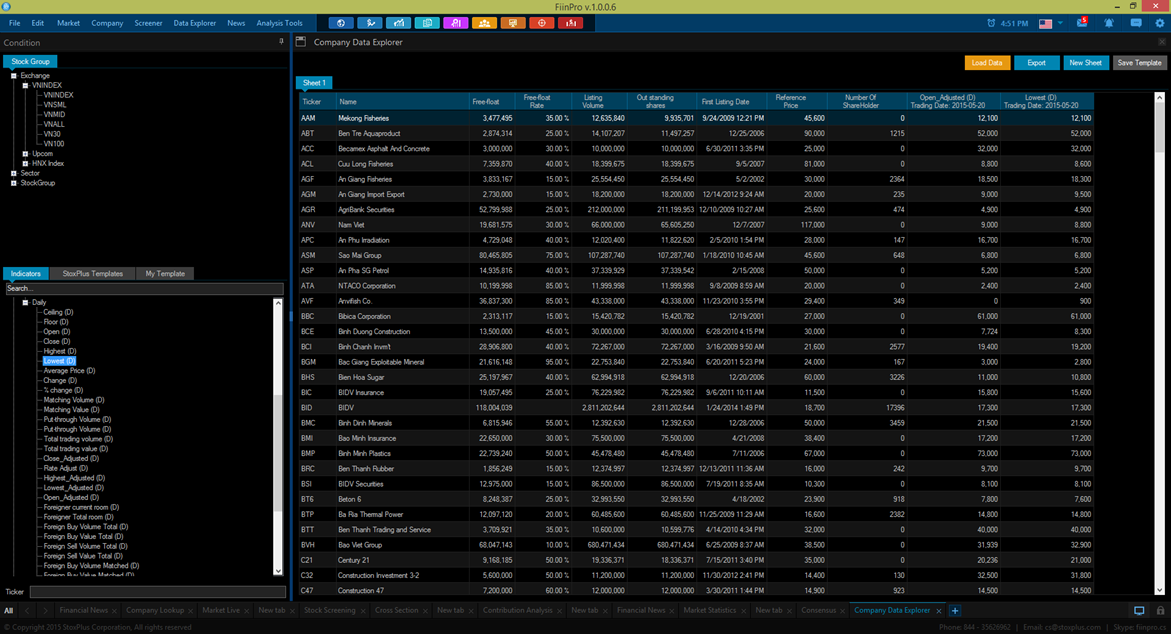
Dữ liệu doanh nghiệp
- 1. Mở chức năng Dữ liệu;
- 2. Chọn các mã cổ phiếu từ Nhóm cổ phiếu hoặc nhập trực tiếp từ Tìm kiếm Mã chứng khoán;
- 3. Chọn các chỉ số để Tải dữ liệu hoặc Quý vị có thể chọn một trong các mẫu dữ liệu sẵn có của StoxPlus.
Nếu Quý vị đã lưu mẫu dữ liệu của riêng mình ở thư mục My template, Quý vị có thể mở lại chúng từ thư mục My template; - Chọn nút "Tải dữ liệu" => Dữ liệu sẽ hiển thị.
Quý vị có thể khám phá nhiều bảng dữ liệu khác nhau bằng cách bấm vào nút “Trang mới” để mở một môi trường làm việc mới.
Xuất Excel
Bằng cách chọn nút “Xuất Excel” Quý vị có thể xuất các dữ liệu mình đang xem ra tài liệu Excel. Một công cụ “Làm mới dữ liệu” được tích hợp trong Excel đã được xuất ra từ phần mềm cho phép người dùng làm mới lại dữ liệu ở phiên làm việc tiếp theo bằng cách kích vào “Làm mới dữ liệu” ở trong thanh công cụ trong excel.
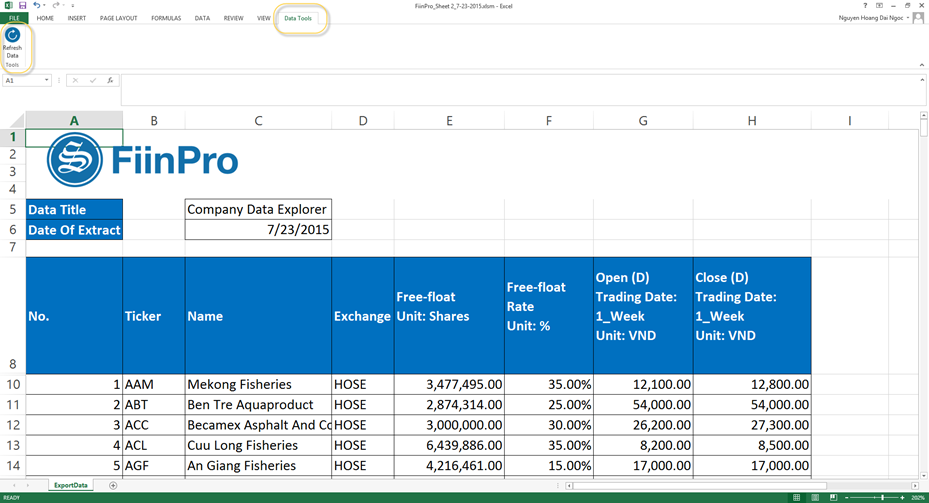
Làm mới dữ liệu
Lưu mẫu
Để lưu các dữ liệu của người dùng đã tải vào thư mục Lưu mẫu, chọn “Lưu mẫu” sau đó điền tên của thư mục và chọn “Lưu.
Dữ liệu: Dữ liệu giao dịch doanh nghiệp
Company Historical Data
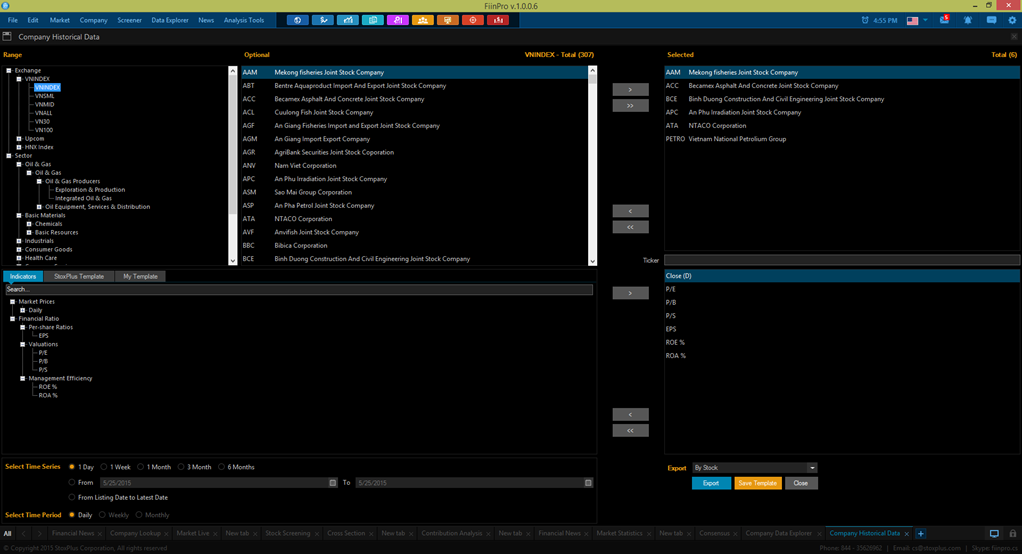
Data: Company Historical Data
-
Input stock quotes by two ways:
- Select a particular stock group on Range of stock groups > A selected stock group component will appear on Optional => Add stock quotes to Selected
- Input the stock quote directly on Ticker box
- Select and Add indicator from Indicator/StoxPlus Template/ My Template
- Select Time series and Time period
-
Select Export options:
- By stock: Each sheet of the exported file will contain data of each stock quote
- By sequence: All data will be included in one sheet.
- Click Export button.
By clicking Save Template button, all selected stock quotes and indicator will be saved into My Template and user can re-open it for next working session.
Phân tích Chiến lược
Phân tích Chiến lược cho thấy mối tương quan giữa thị trường chứng khoán và các yếu tố vĩ mô. Nó cũng cho phép Quý vị tìm kiếm và kiểm tra lại tình hình đầu tư cụ thể dựa trên dữ liệu lịch sử và giúp Quý vị tạo các ý tưởng đầu tư.
Nghiên cứu chiến lược
- Chọn một chỉ số thị trường
- Chọn các chỉ số vĩ mô từ một nhóm chỉ số vĩ mô (như GDP, CPI,…)
Một biểu đồ tương quan giữa chỉ số thị trường được lựa chọn và chỉ số vĩ mô sẽ được hiển thị.
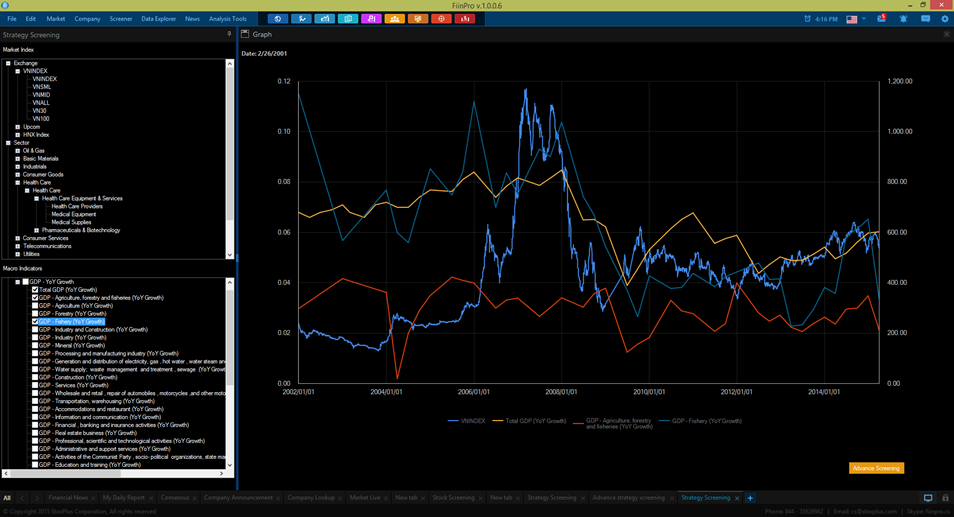
Nghiên cứu chiến lược
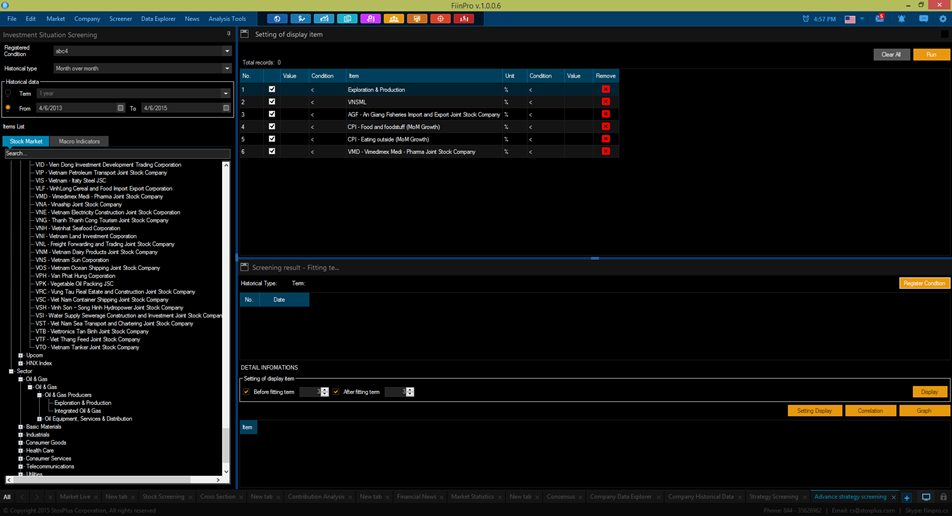
Sàng lọc nâng cao
- Chọn Loại lịch sử
-
Chọn Dữ liệu lịch sử
- Chọn giới hạn thời gian có sẵn
- Tự đặt khoảng thời gian
- Chọn các mục từ Chỉ số vĩ mô và Thị trường chứng khoán
- Thiết lập điều kiện đầu vào cho Chiến lược sàng lọc
- Nhấn nút Chạy => Phân tích chiến lược được thiết lập
- Để có thể đối chiếu kết quả lọc sâu hơn, chọn một chỉ tiêu trong phần kết quả sàng lọc, sau đó thêm nhiều chỉ số hơn bằng cách kích vào Thiết lập chỉ tiêu để thiết lập hạn mức hiển thị.
- Kích vào Tương quan để hiển thị Đồ thị tương quan
- Kích vào Đồ thị để hiện thị Đồ thị
Quý vị có thể lưu vào mở lại điều kiện đã chọn cho phiên đăng nhập tiếp theo bằng cách kích vào Đăng ký điều kiện.
Phân tích nâng cao
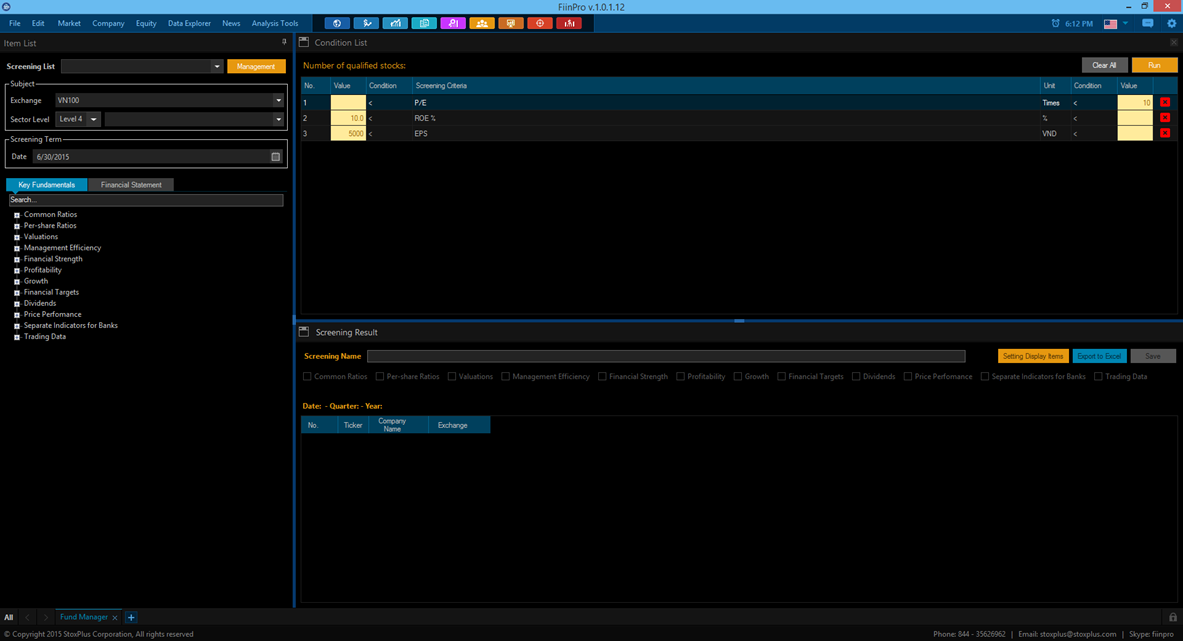
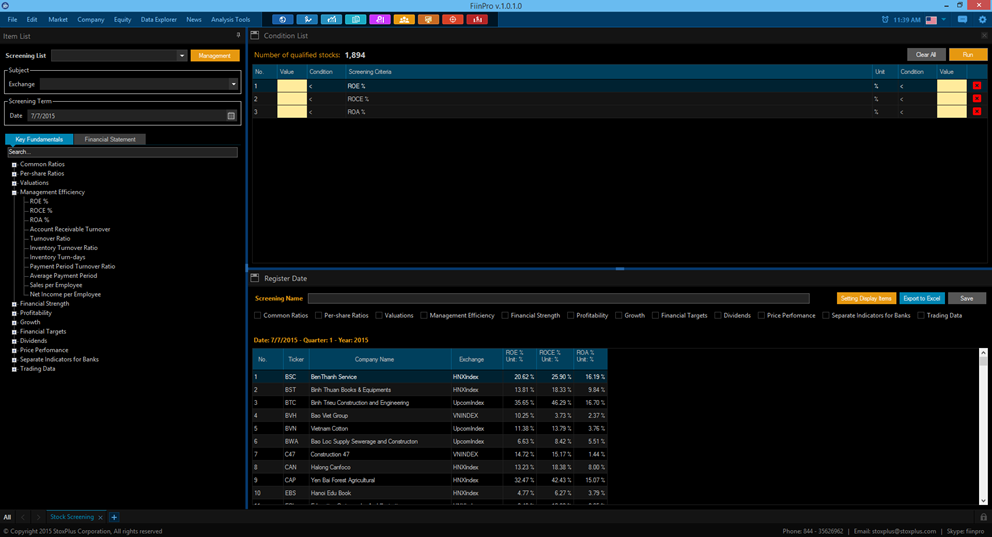
Stock Screening
Stock Screening function allows users to screen and establish a list of stocks by user’s definition. It includes nearly 1,000 screening indicators of fundamentals, technical and financial statement. User can export screening result to excel file or save it into Group Setting function.
Stock Screening
- Select Subject (Exchange)
- Select Screening term
- Select indicators for stock screening
- Input condition for indicators
- Click “Run” button => Screening Result display
- For quick item display, select group of indicator check box or click “Setting Display Item” button, then add more indicators.
User can save the screening condition by clicking “Save” button and re-open it for next using session. User can also export the screening result to excel by clicking “Export to Excel” button.
Stock Screening
Contribution Analysis
This function is used for contribution analysis of individual stocks for a benchmark. It enables users to know which individual stocks drive up the benchmark and which drive it down.
Contribution Analysis
- Select Subject (Type of Contribution Analysis and Market Index)
-
Select Term
- Period
- From – to
- Click Run button => Contribution Analysis result display.
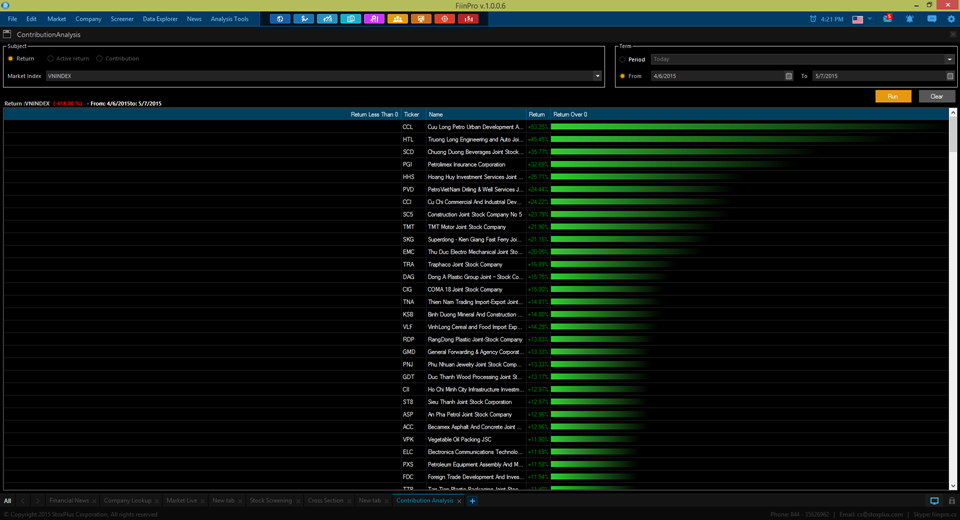
Contribution Analysis
Cross Section
The Cross Section function allows users to cross sectional comparison analysis between different stocks or between different indices among one stock. This function provides charts, table and excel export functions for convenient operation and analysis.
- Select Stock Group
- Select Date
- Click Display Item button for item selection and display. If user has registered condition previously, user can re-open it on Condition List.
- After finishing item selection step, click Run button > The result will be displayed.
To register the setting condition, click Register Condition button then input the Condition name and click Register. User can also manage existing condition by clicking Clear button to delete it.
To see the correlation between each item, click Graph button for Graph display. For user’s convenience, user can also export the data to excel file simply by clicking Export Excel button.
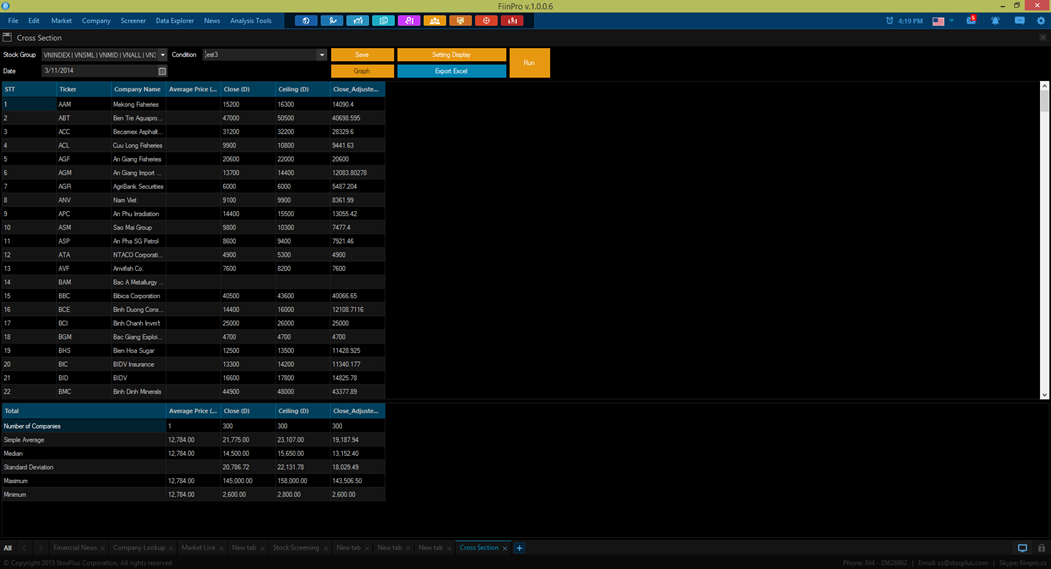
Cross Section
Financial News
This function brings all the latest business, financial and market news in Vietnam, gives users the overview of market daily movement. Users can also set a daily report which they are interested in.
Financial News
Getting the latest financial news, including Macro & Policies, Market Analysis, Banks, Commodities… for market daily overview. User can also search for news by key words, categories, news source, time frame and save it as user’s My Daily Report.
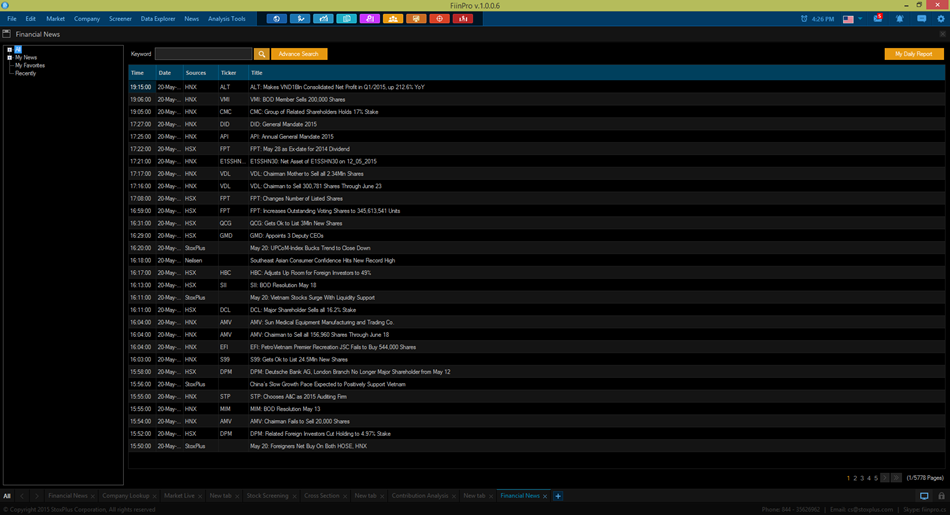
Financial News
Company Announcement
Giving user all information about corporate operation and its prospects. Searching by ticker or keywords, user can find all information of corporate earnings release, insider activity and research report about the corporate.
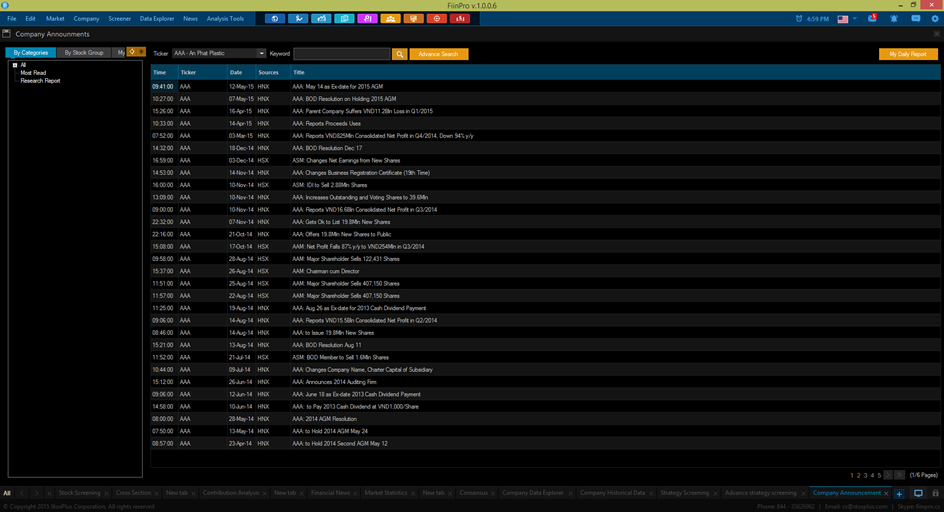
Company Announcement
My Daily Report
Creating your own Daily Report via My Daily Report feature of Financial News. Select news from all categories, sources and time, save it to your Report then export for further working purposes under Word or PDF format.
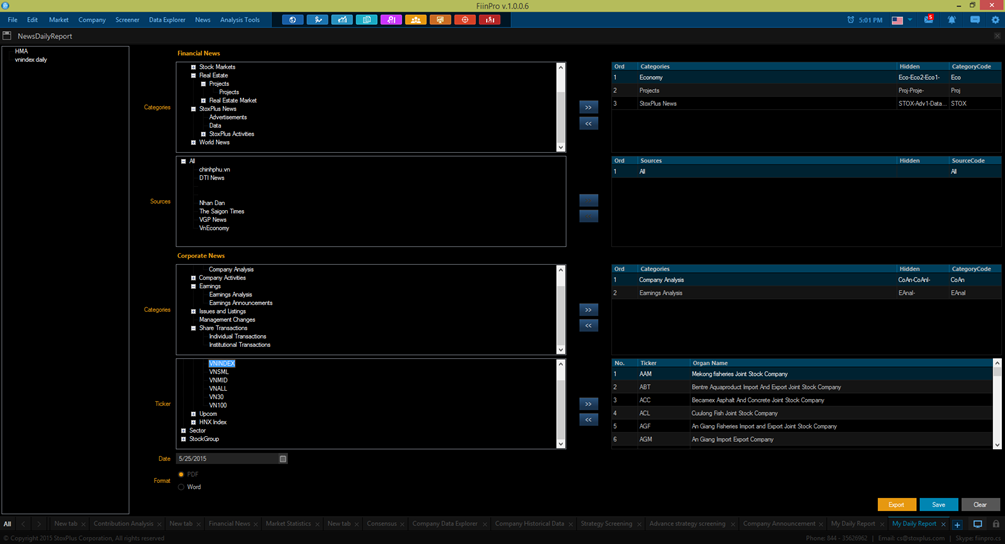
My Daily Report